|
|
|
|
|
|
|
|
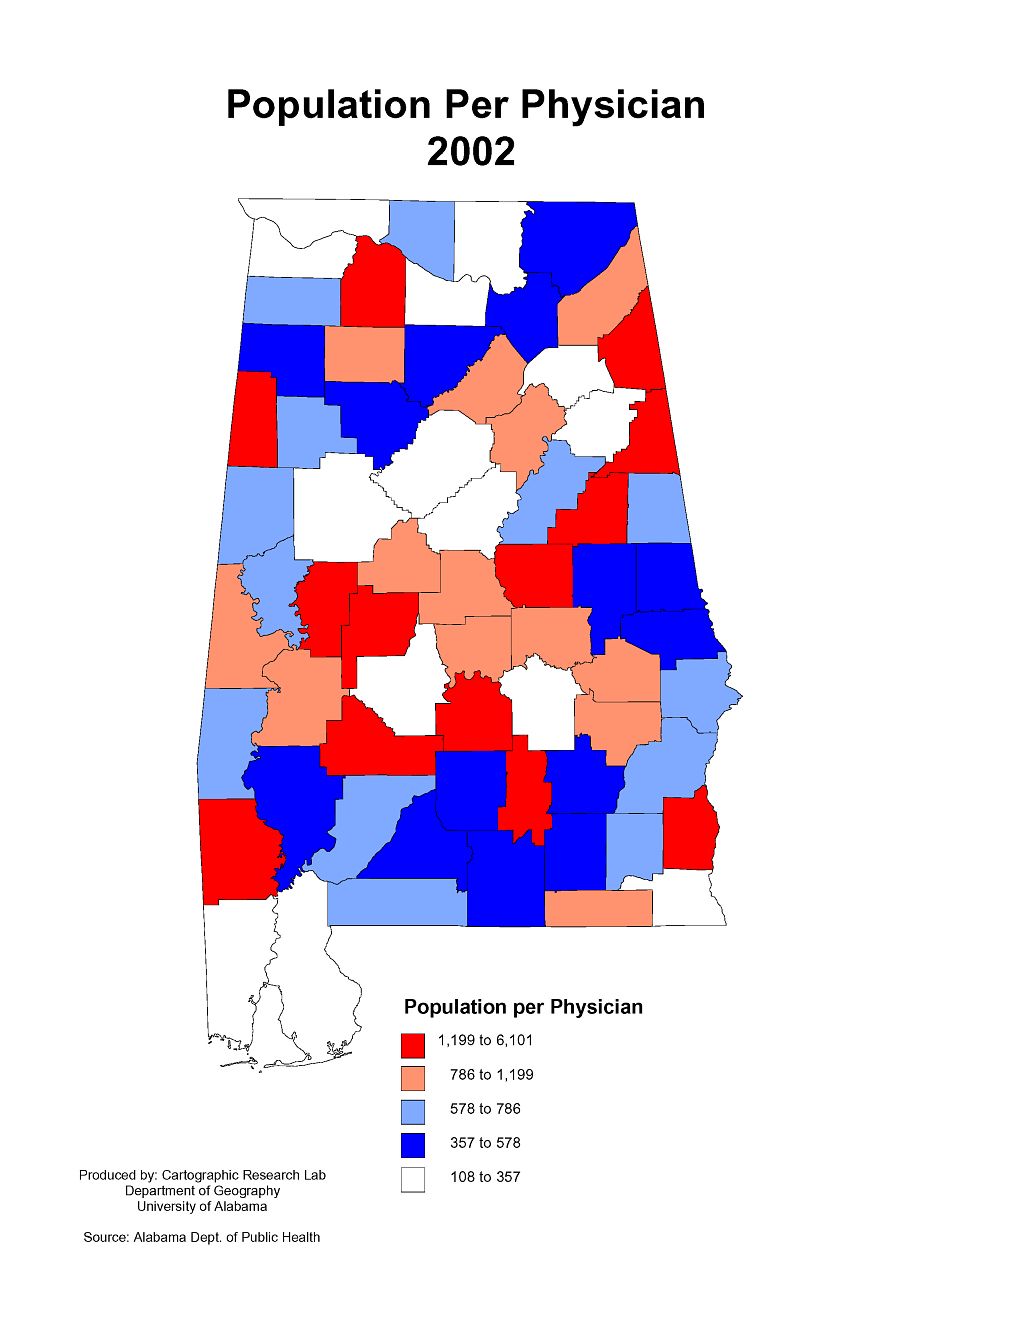
| Population
per Physician, 2002 |
|
|
|
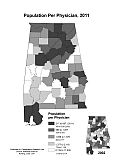
| Population
per Physician, 2011 |
|
|
|
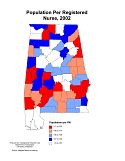
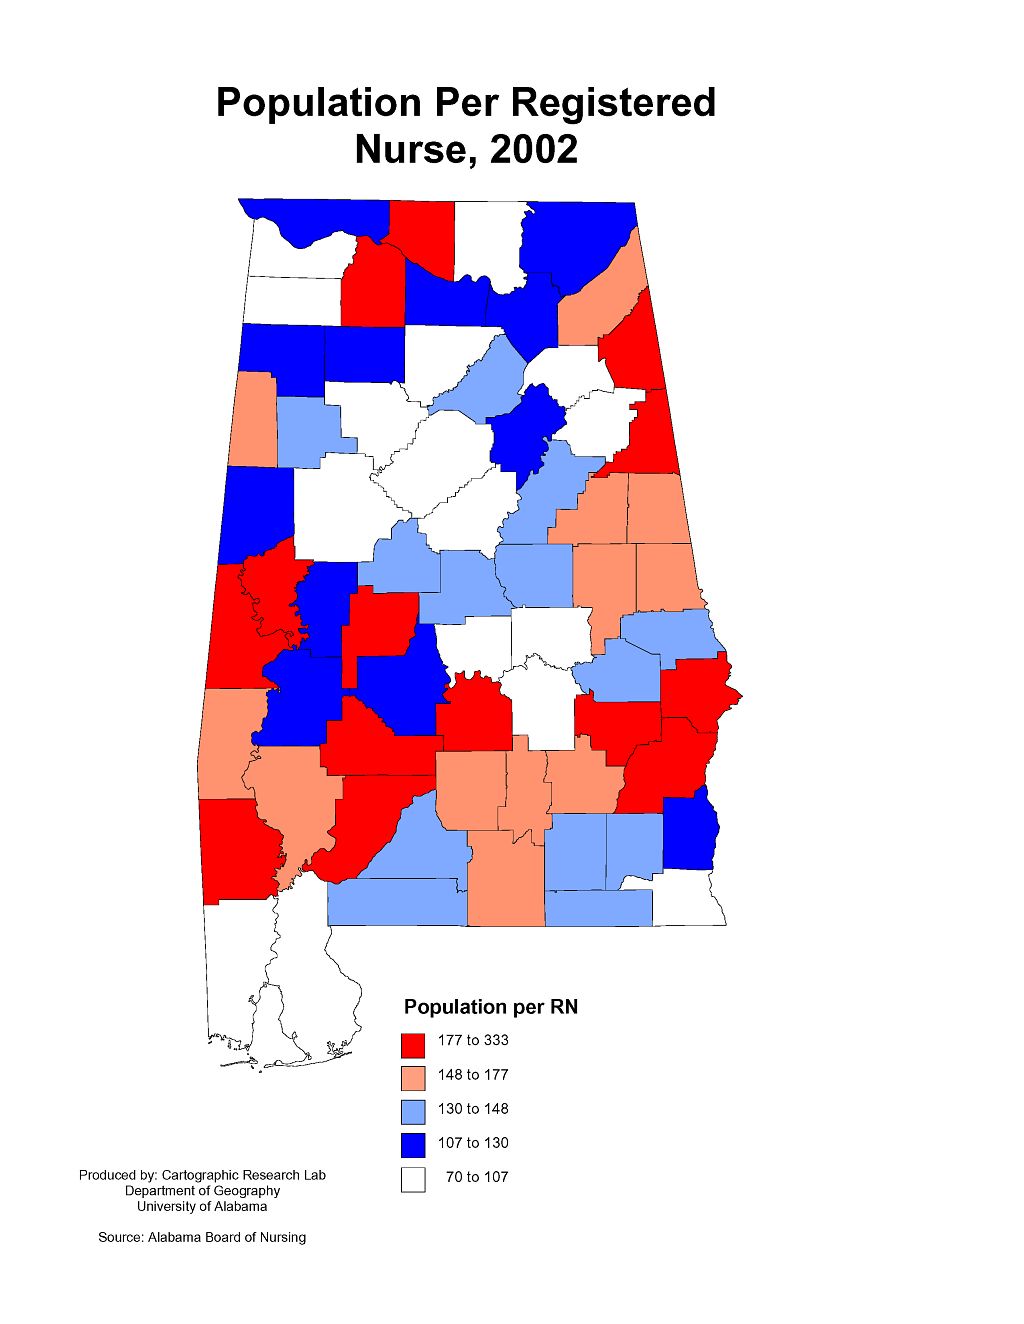
| Population
per Registered Nurse, 2002 |
|
|
|
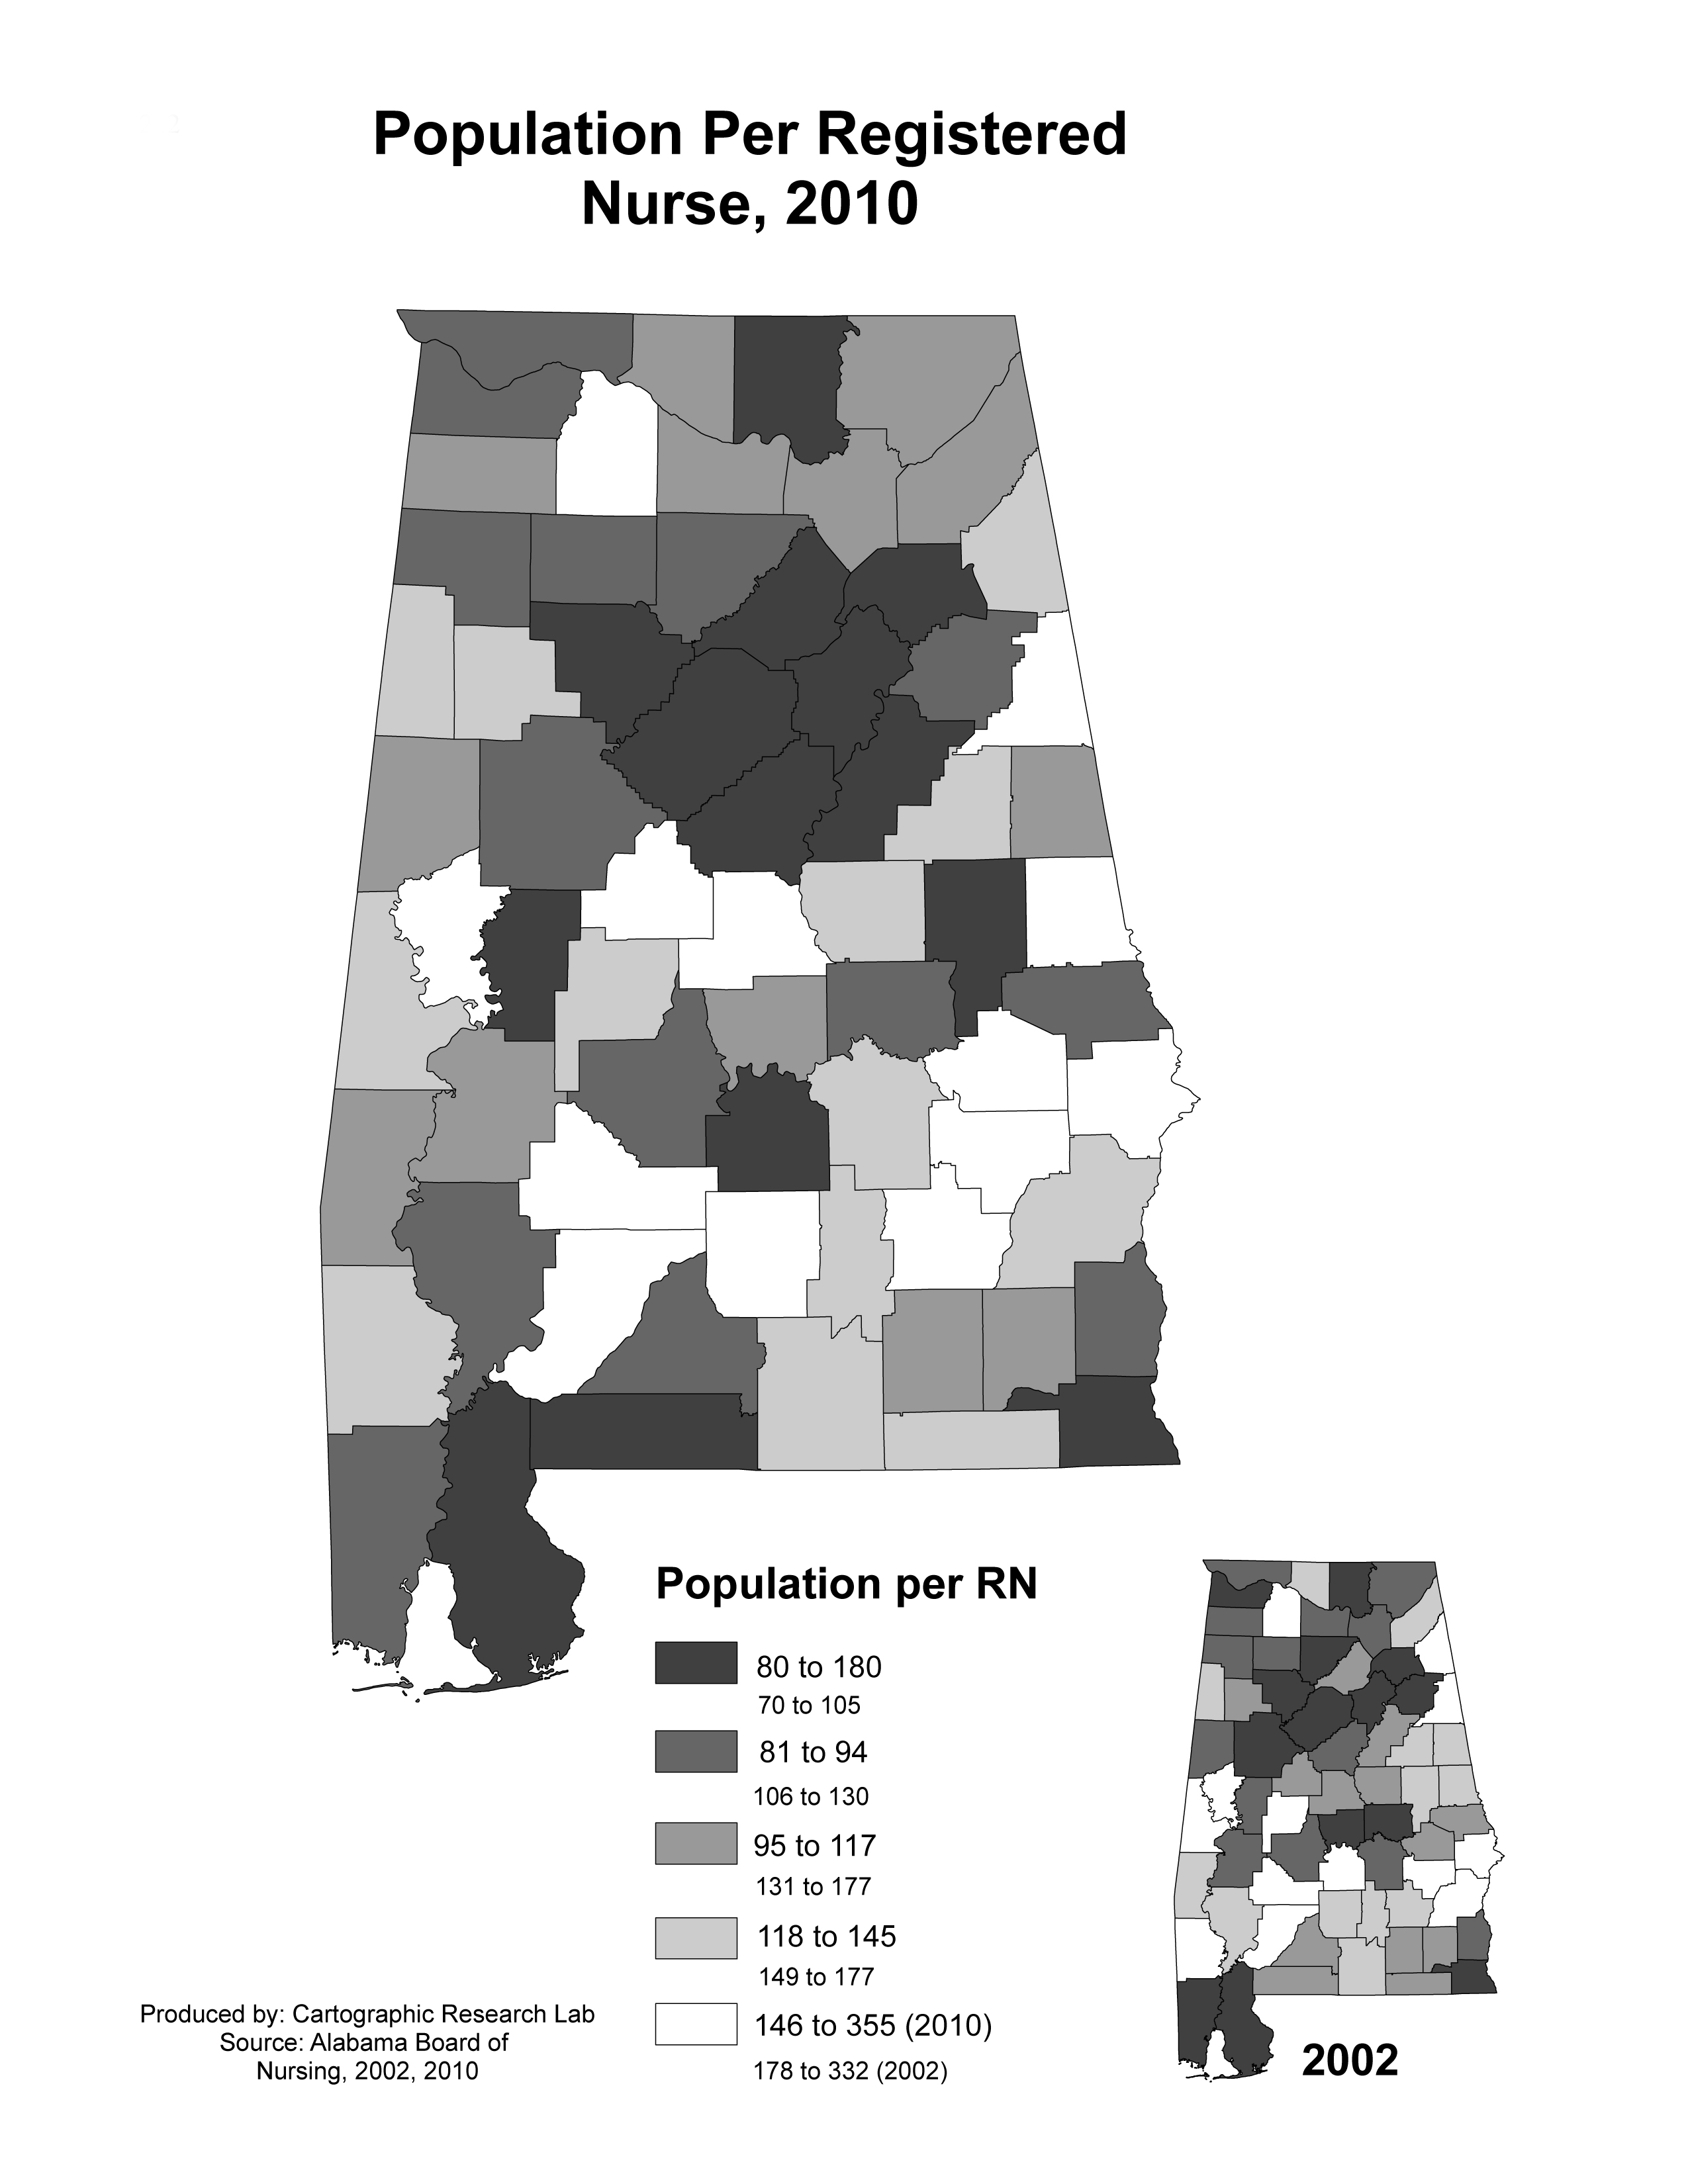
| Population
per Registered Nurse, 2010 |
|
|
|
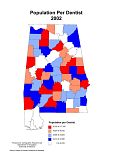
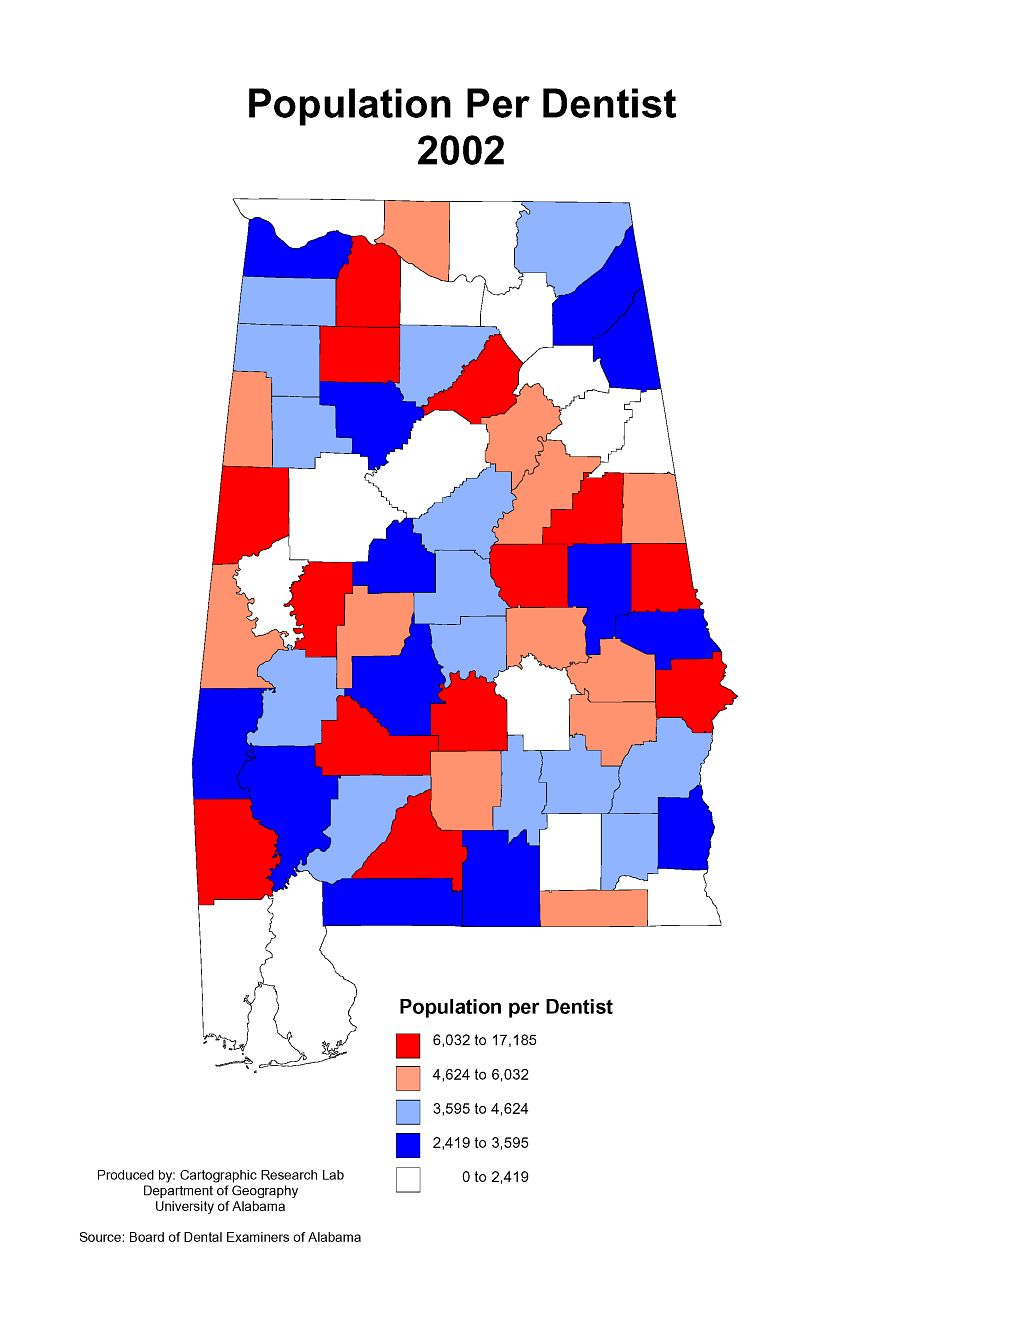
| Population
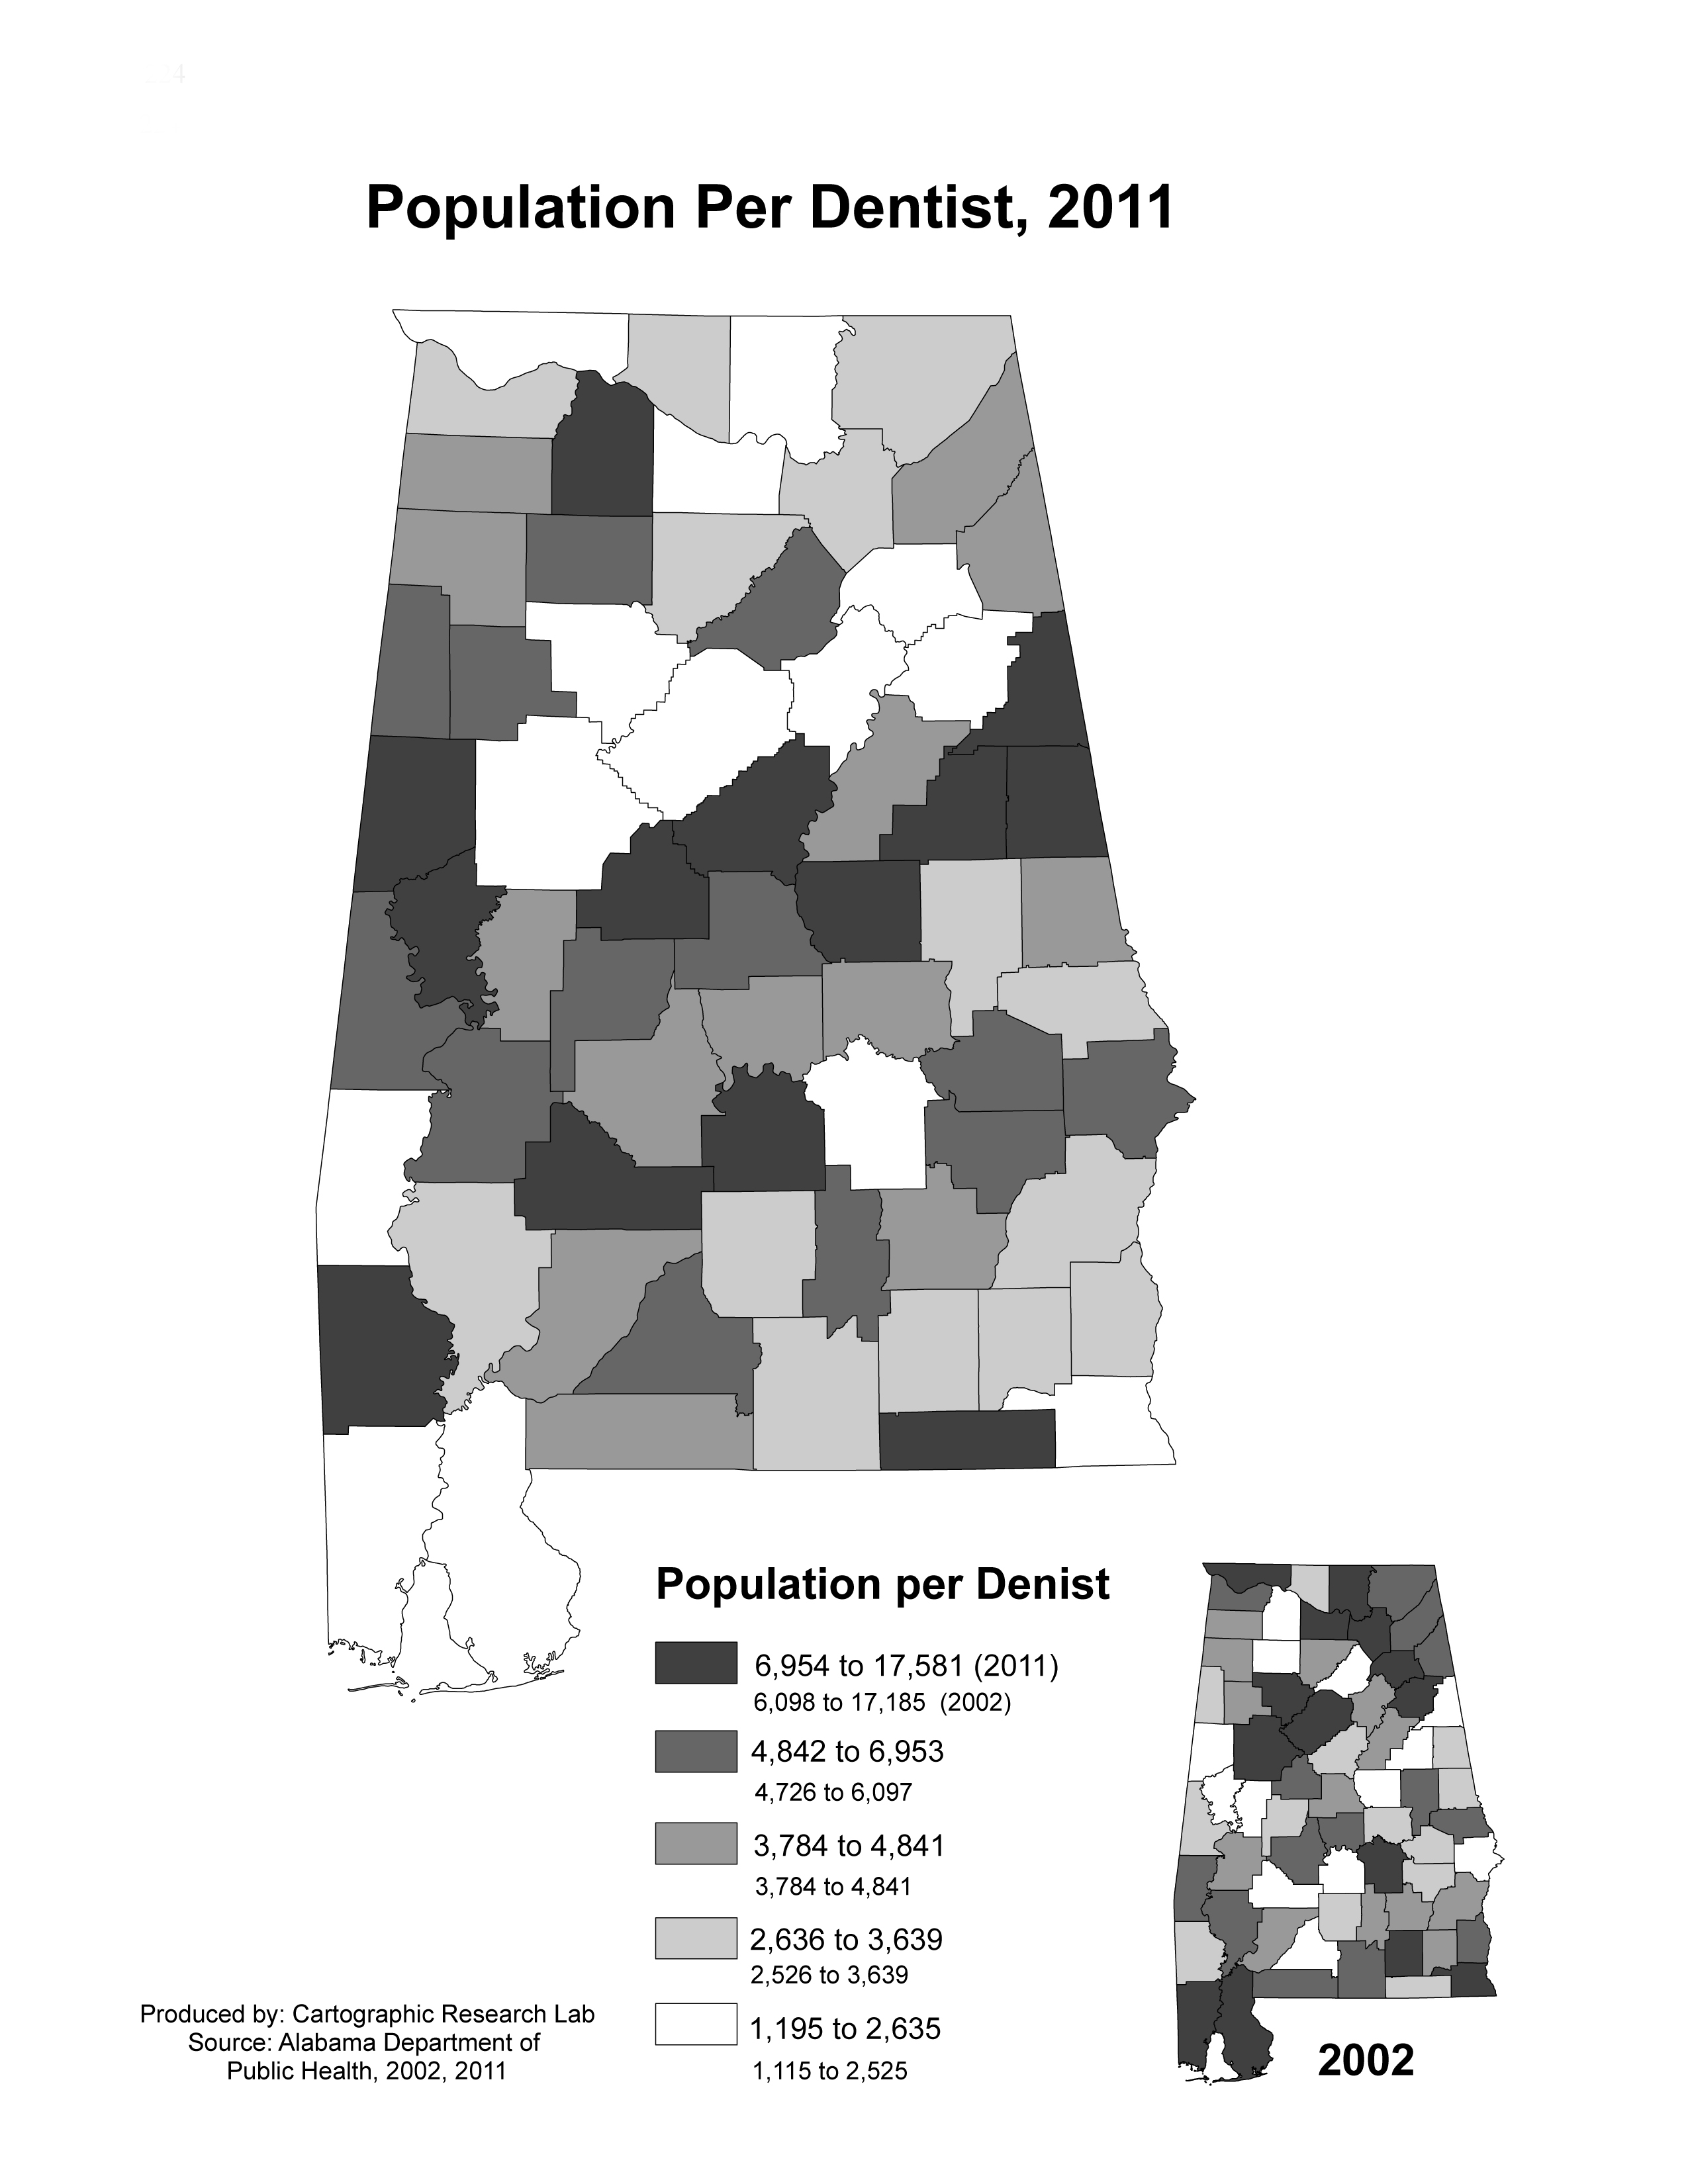
per Dentist, 2002 |
|
|
|
| Population
per Dentist, 2011 |
|
|
|
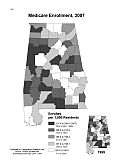
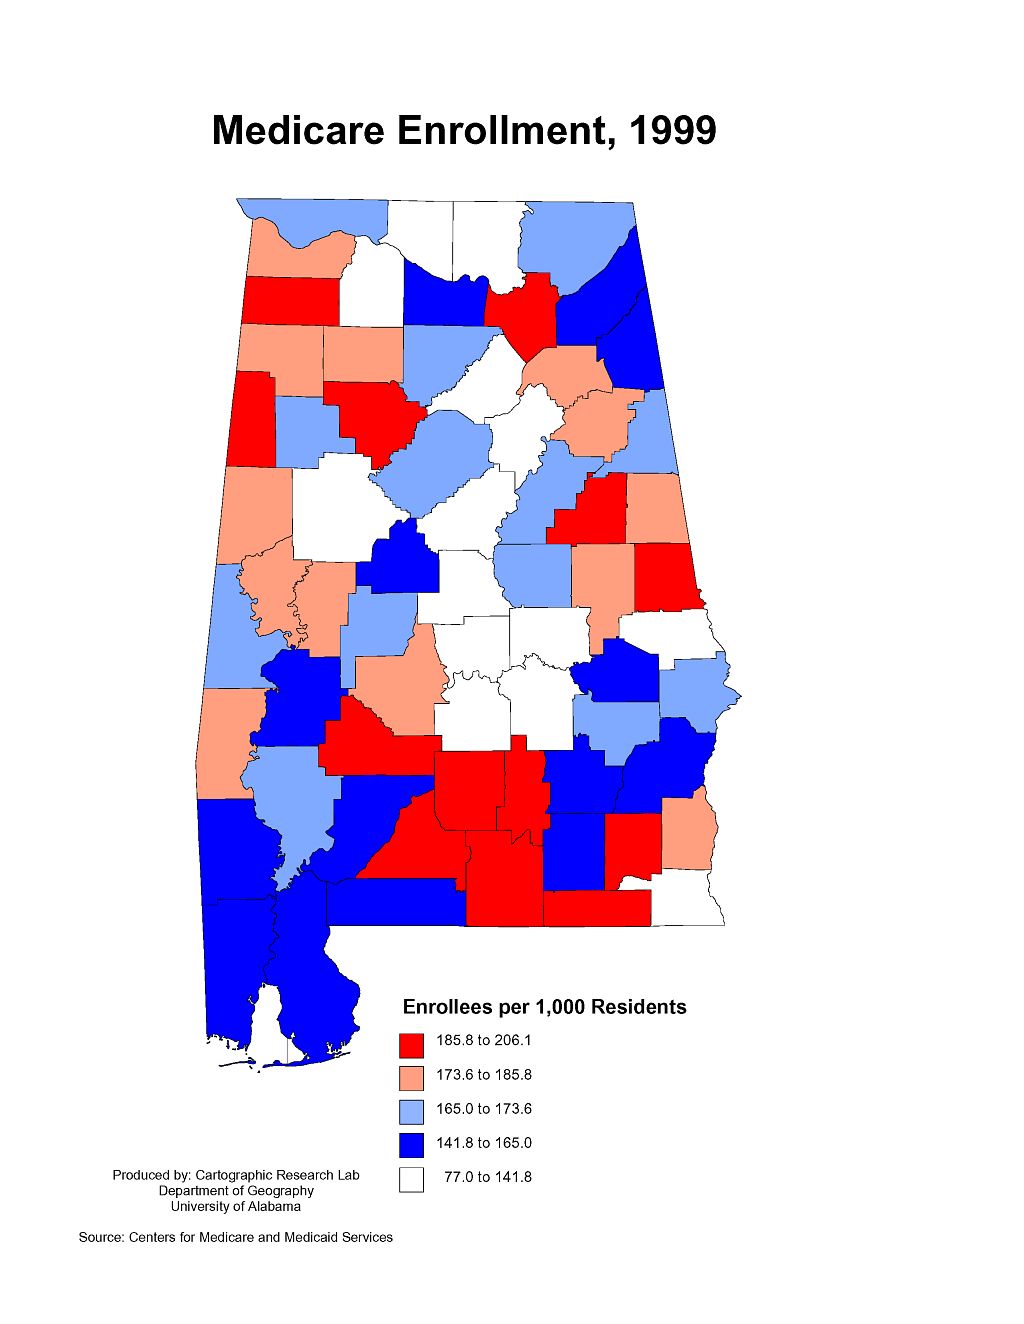
| Medicare
Enrollment, 1999 |
|
|
|
| Medicare
Enrollment, 2007 |
|
|
|
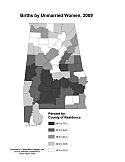
| Births
by Unmarried Women, 2009 |
|
|
|
|
|
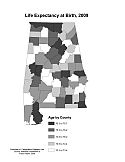
| Life
Expectancy at Birth, 2009 |
|
|
|
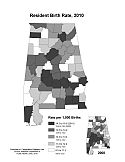
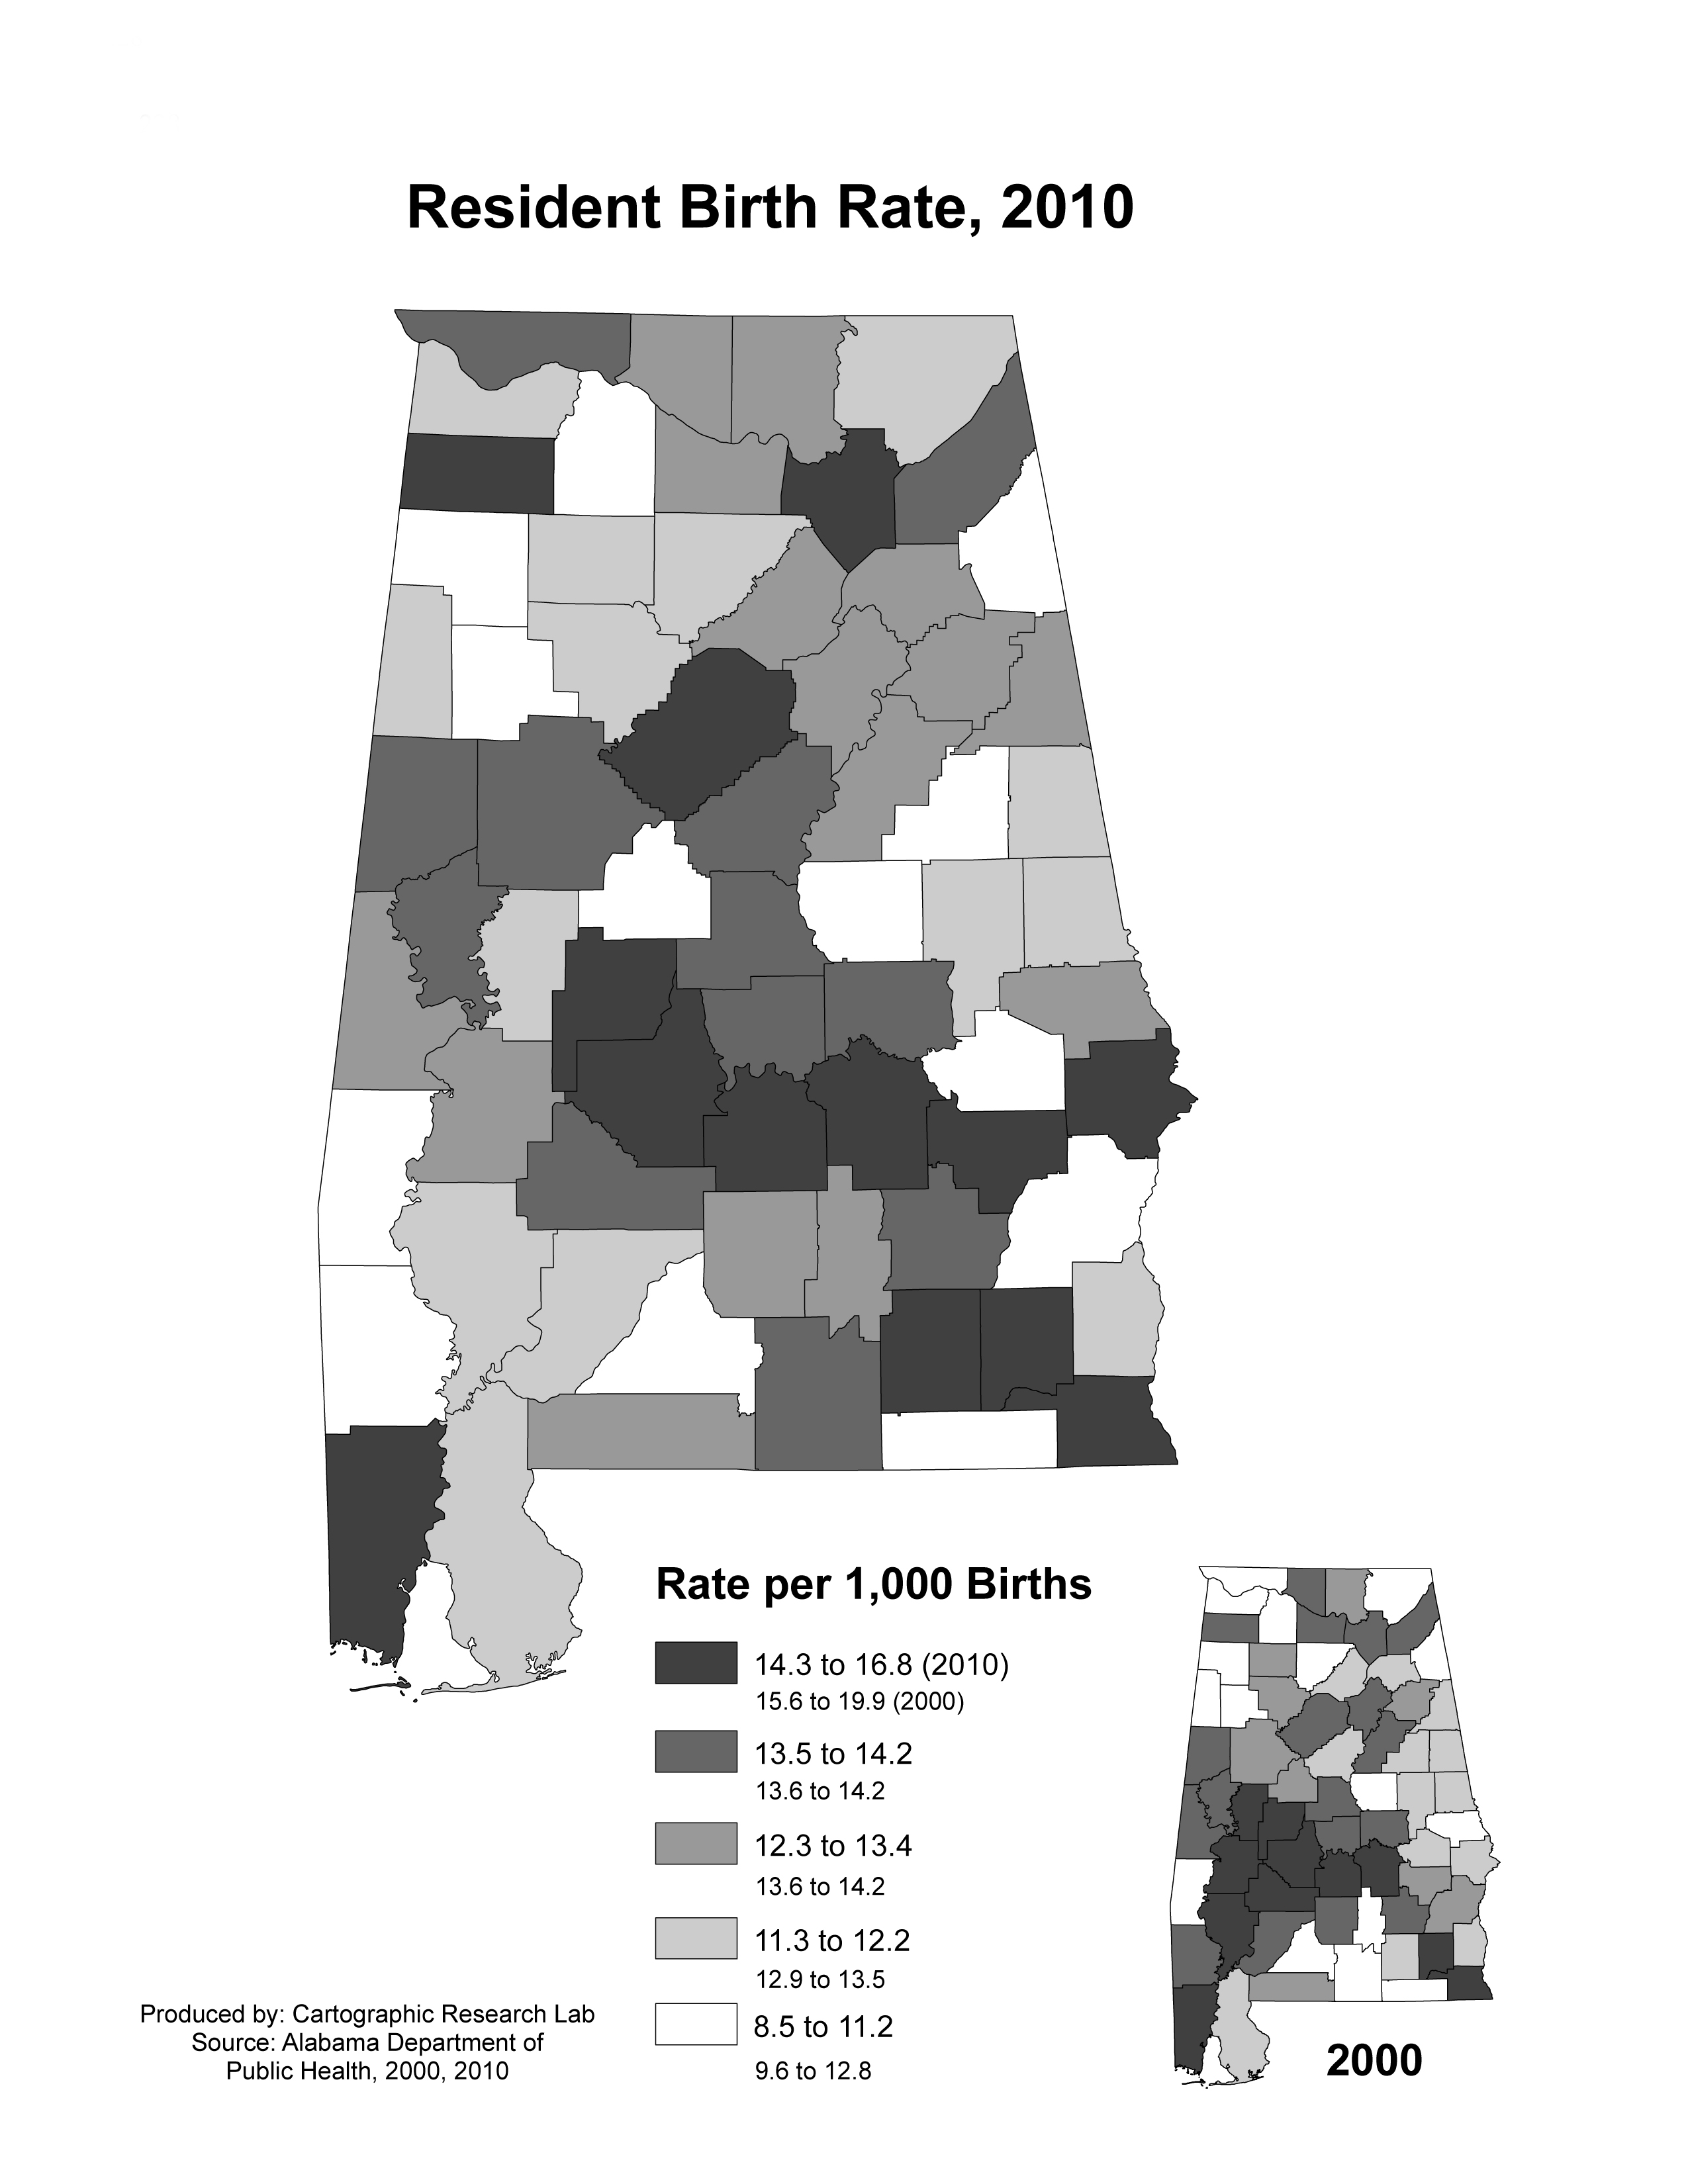
| Resident
Birth Rate, 2010 |
|
|
|
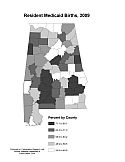
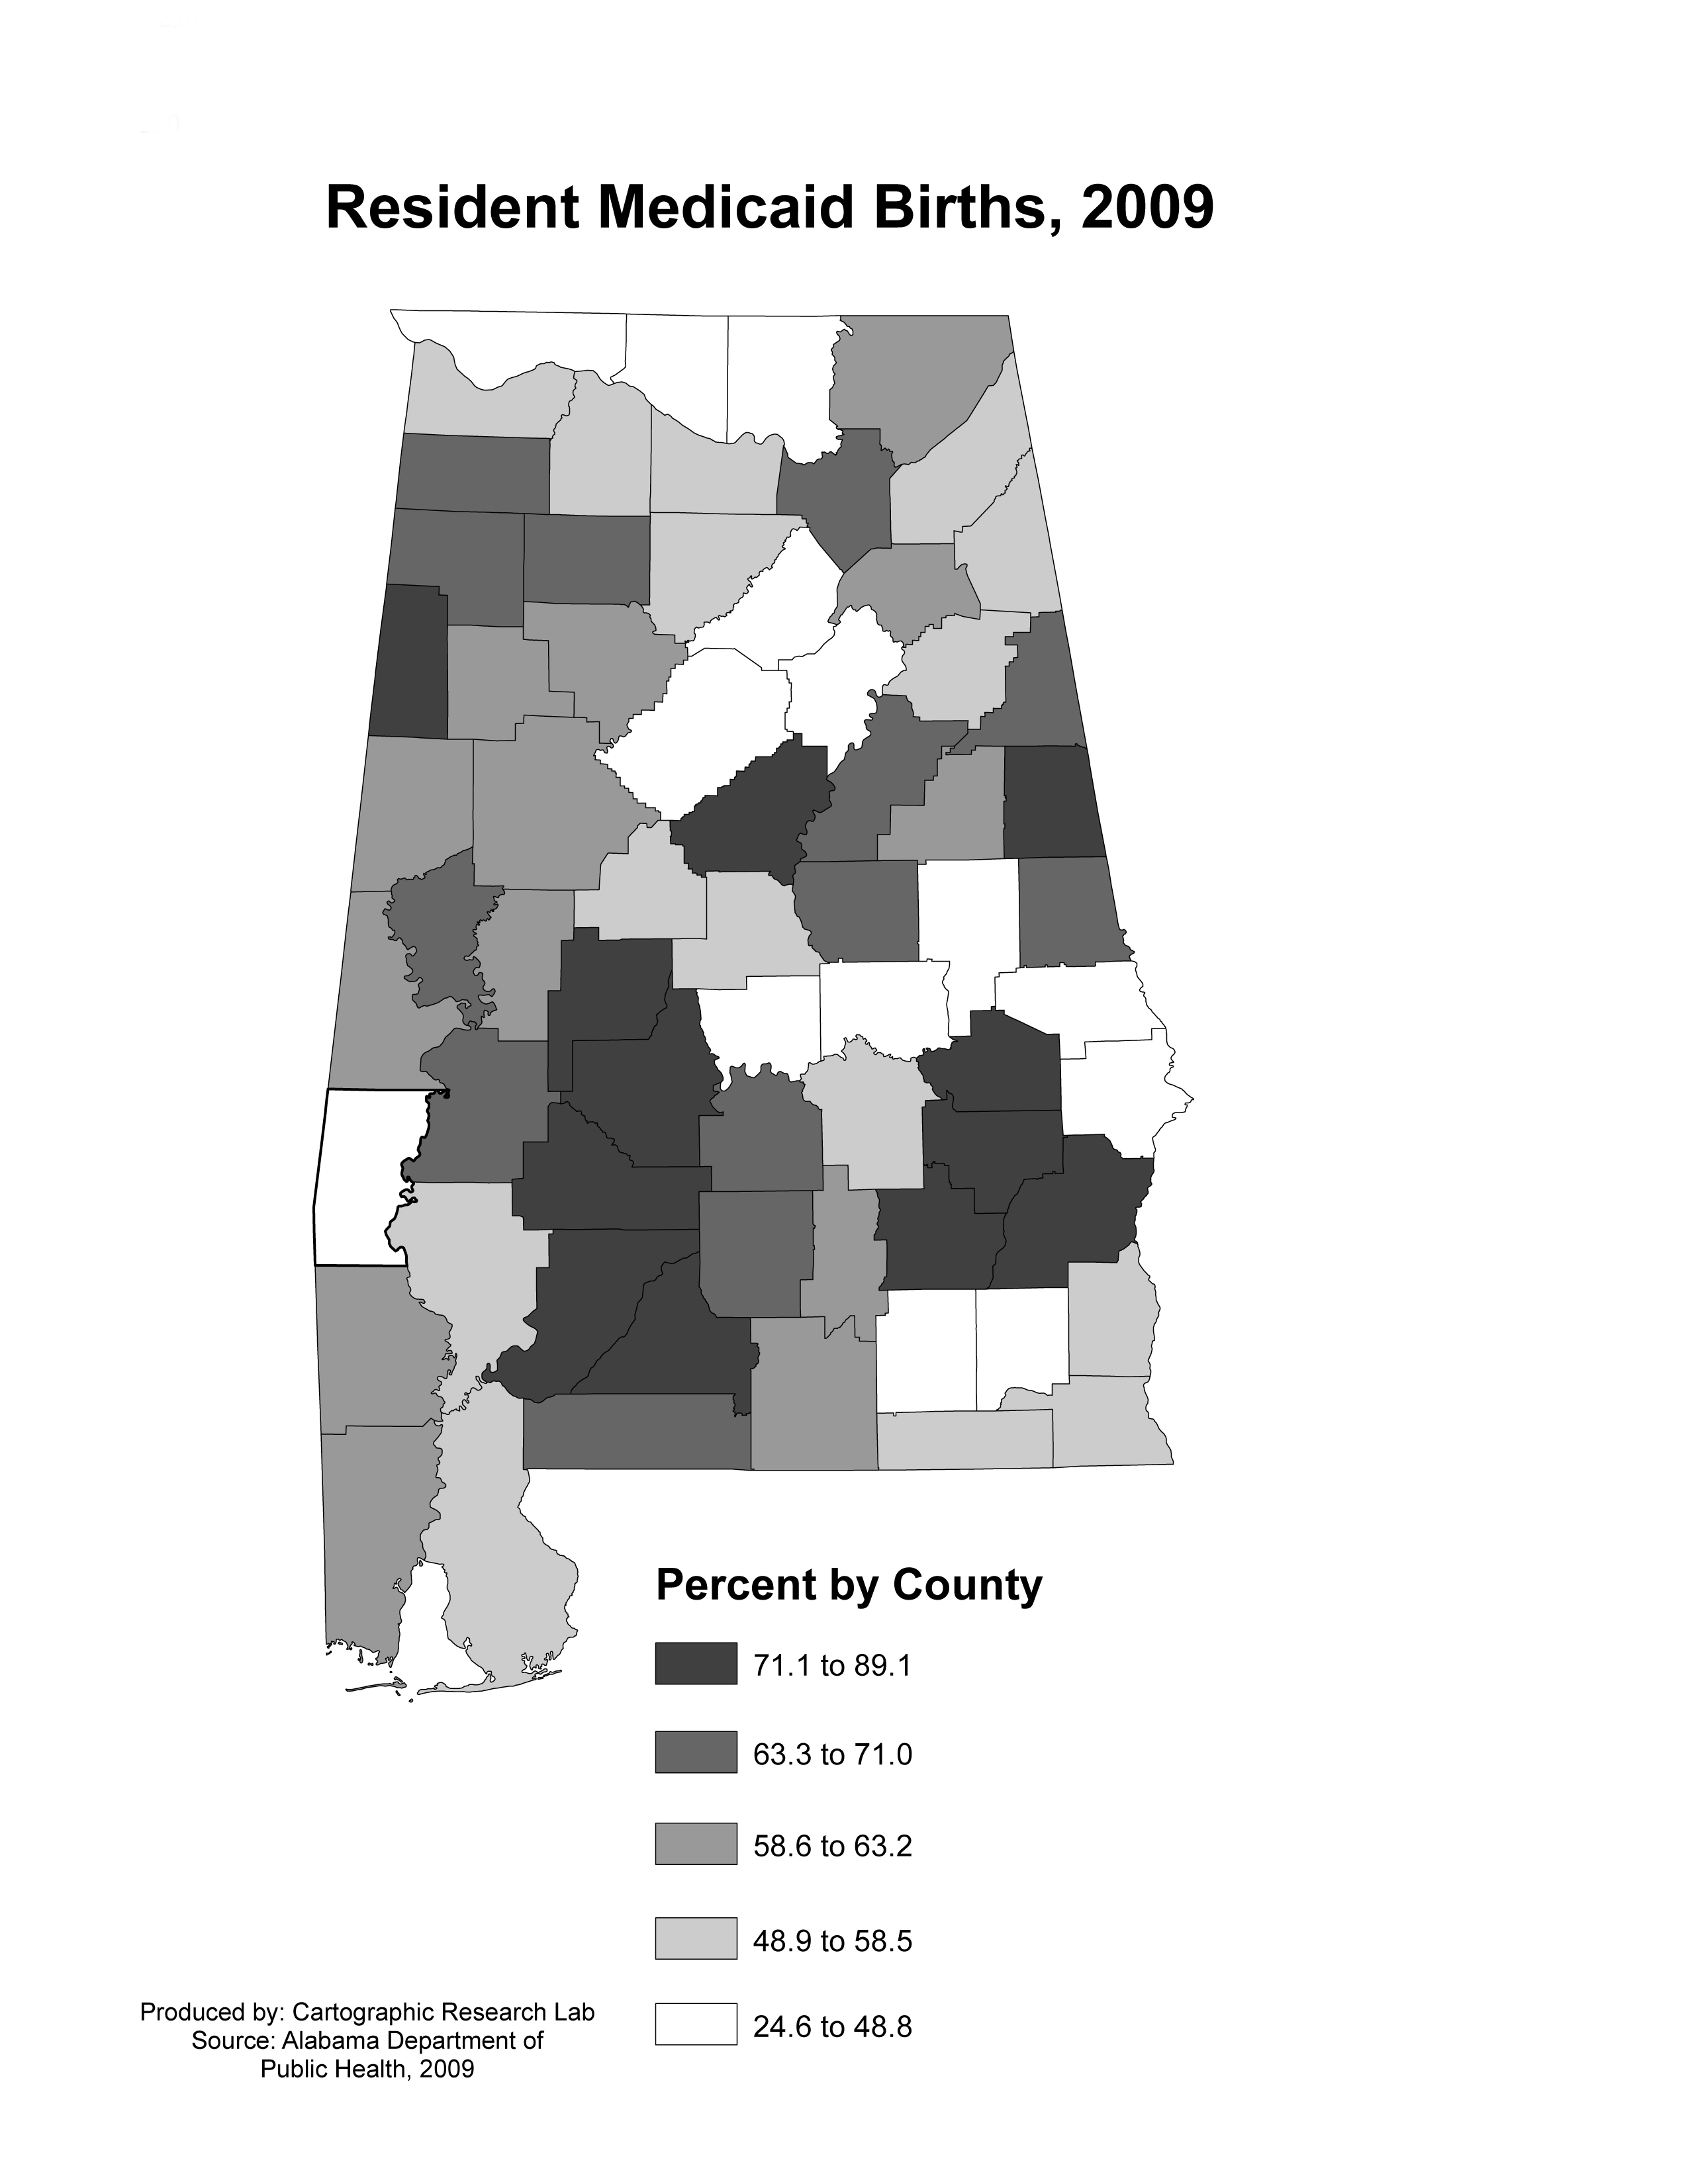
| Resident
Medicaid Births, 2009 |
|
|
|
|
|
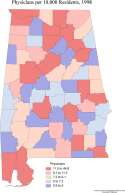
| Physicians
per 10,000 residents, 1998. |
| 
|
|
|
|
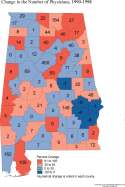
| Change
in the Number of Physicians, 1990-1998 |
| 
|
|
|
|
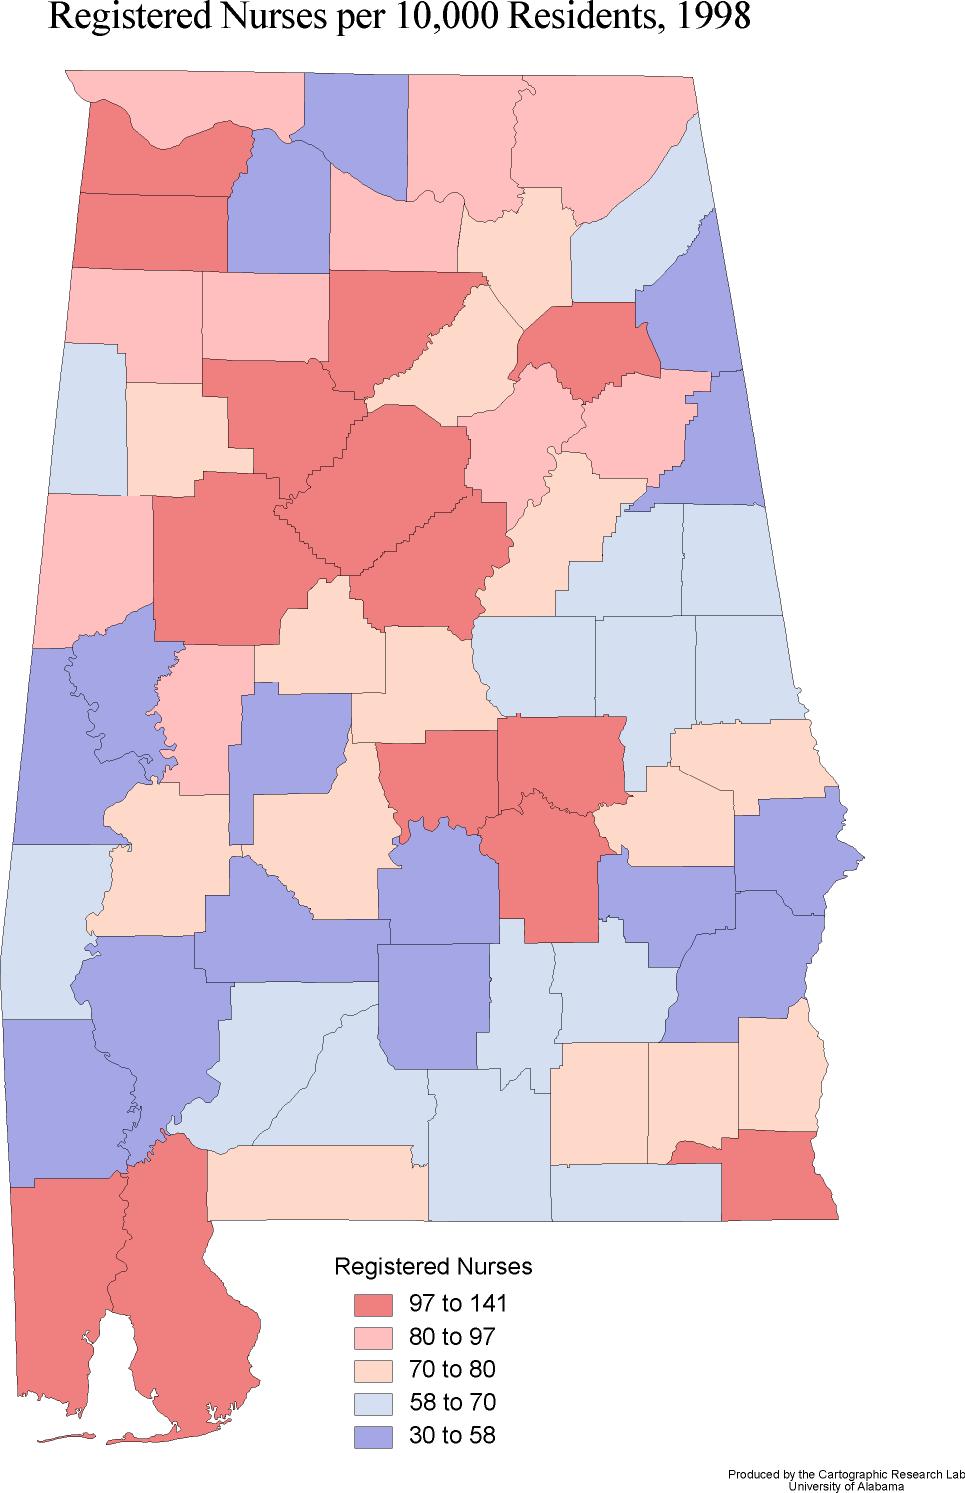
| Registered
Nurses per 10,000 residents, 1998 |
| 
|
|
|
|
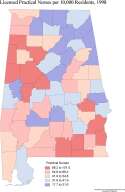
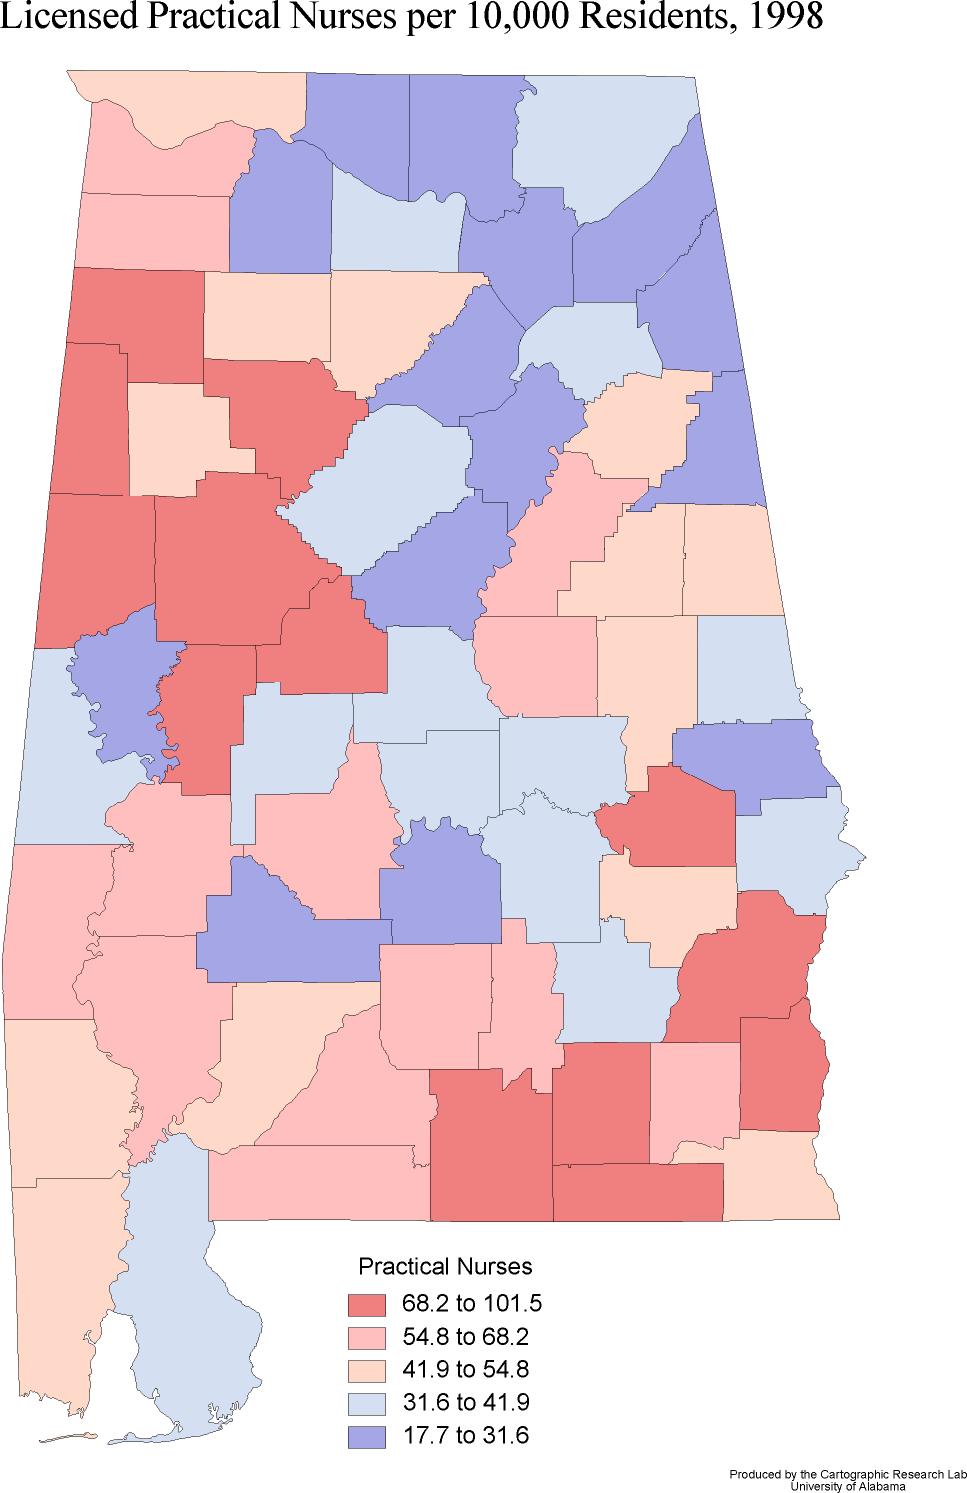
| Licensed
Practical Nurses per 10,000 Residents |
| 
|
|
|
|
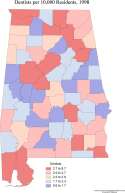
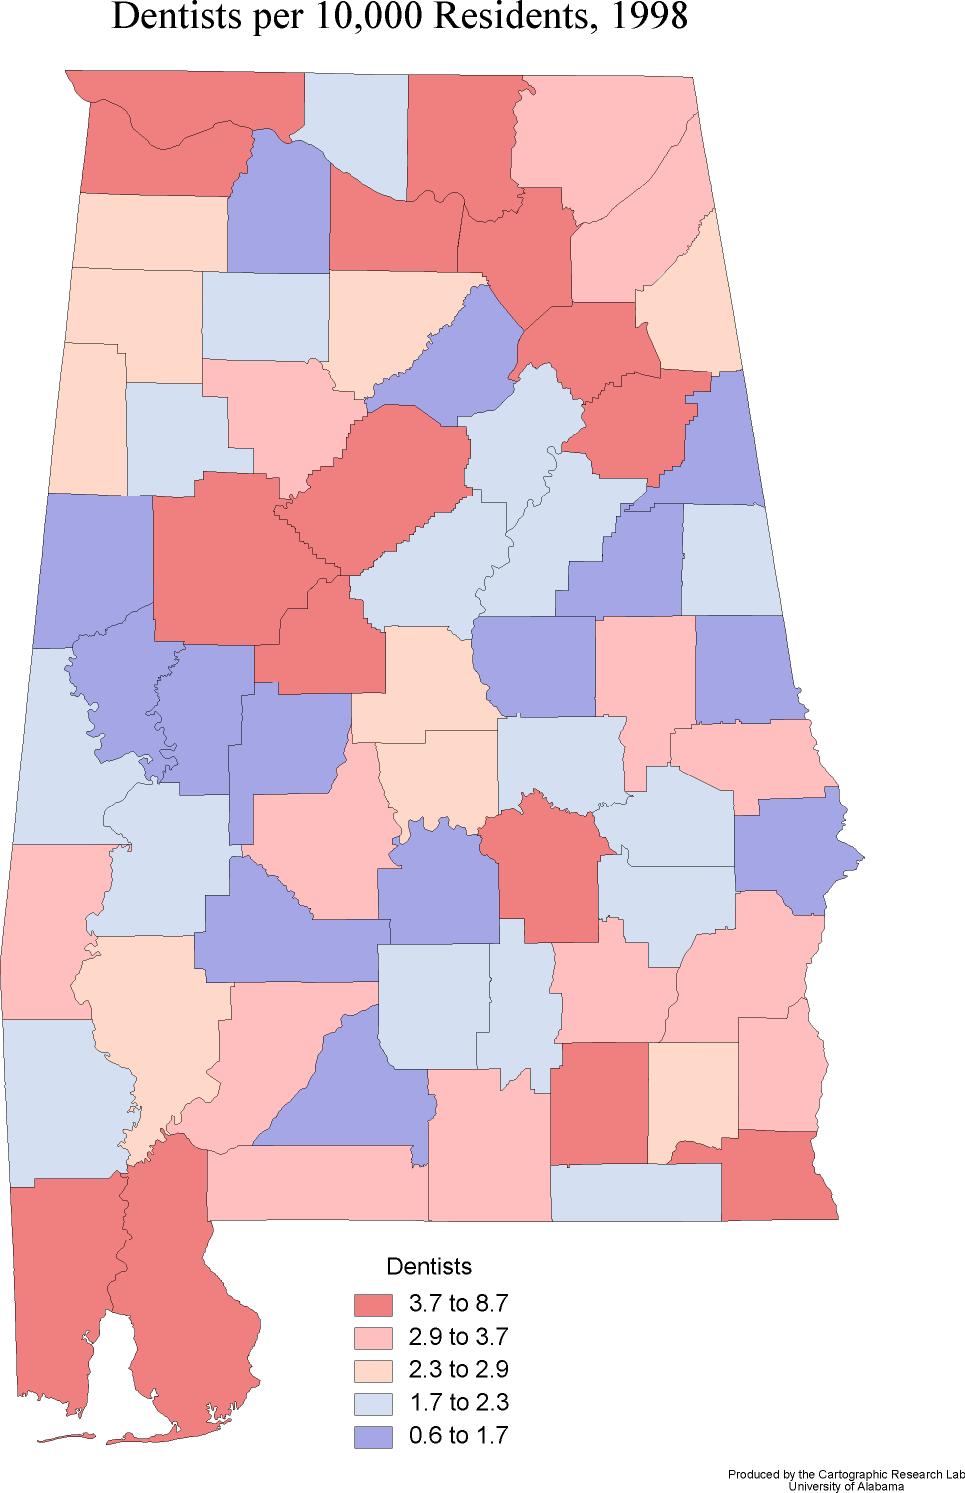
| Dentists
per 10,000 Residents, 1998 |
| 
|
|
|
|
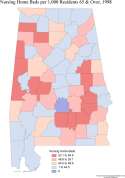
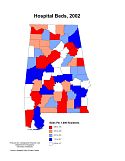
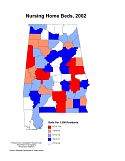
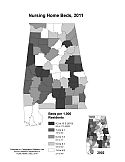
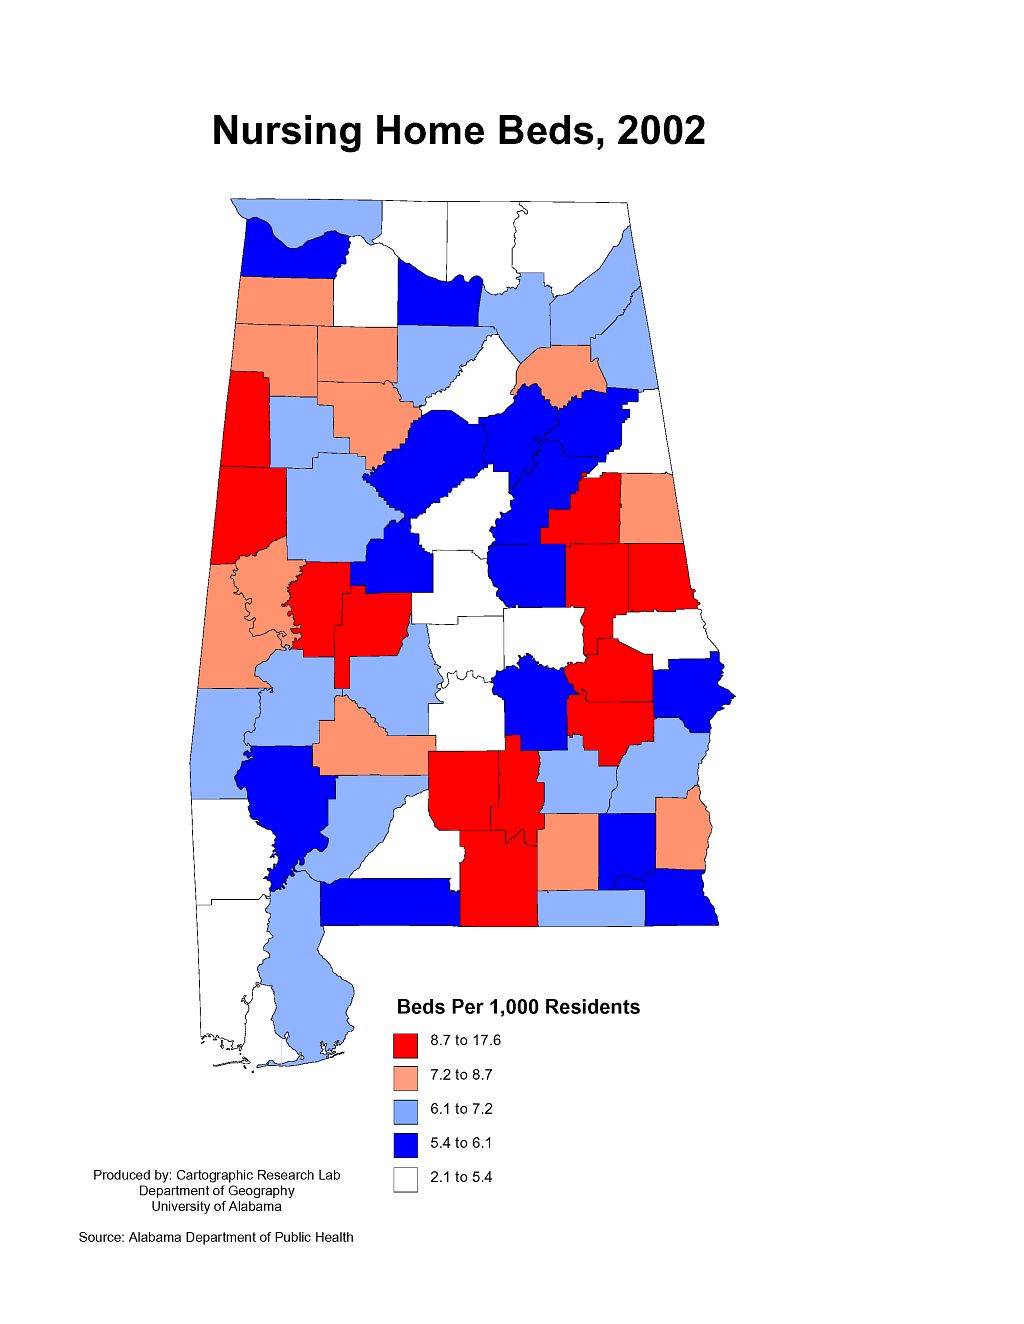
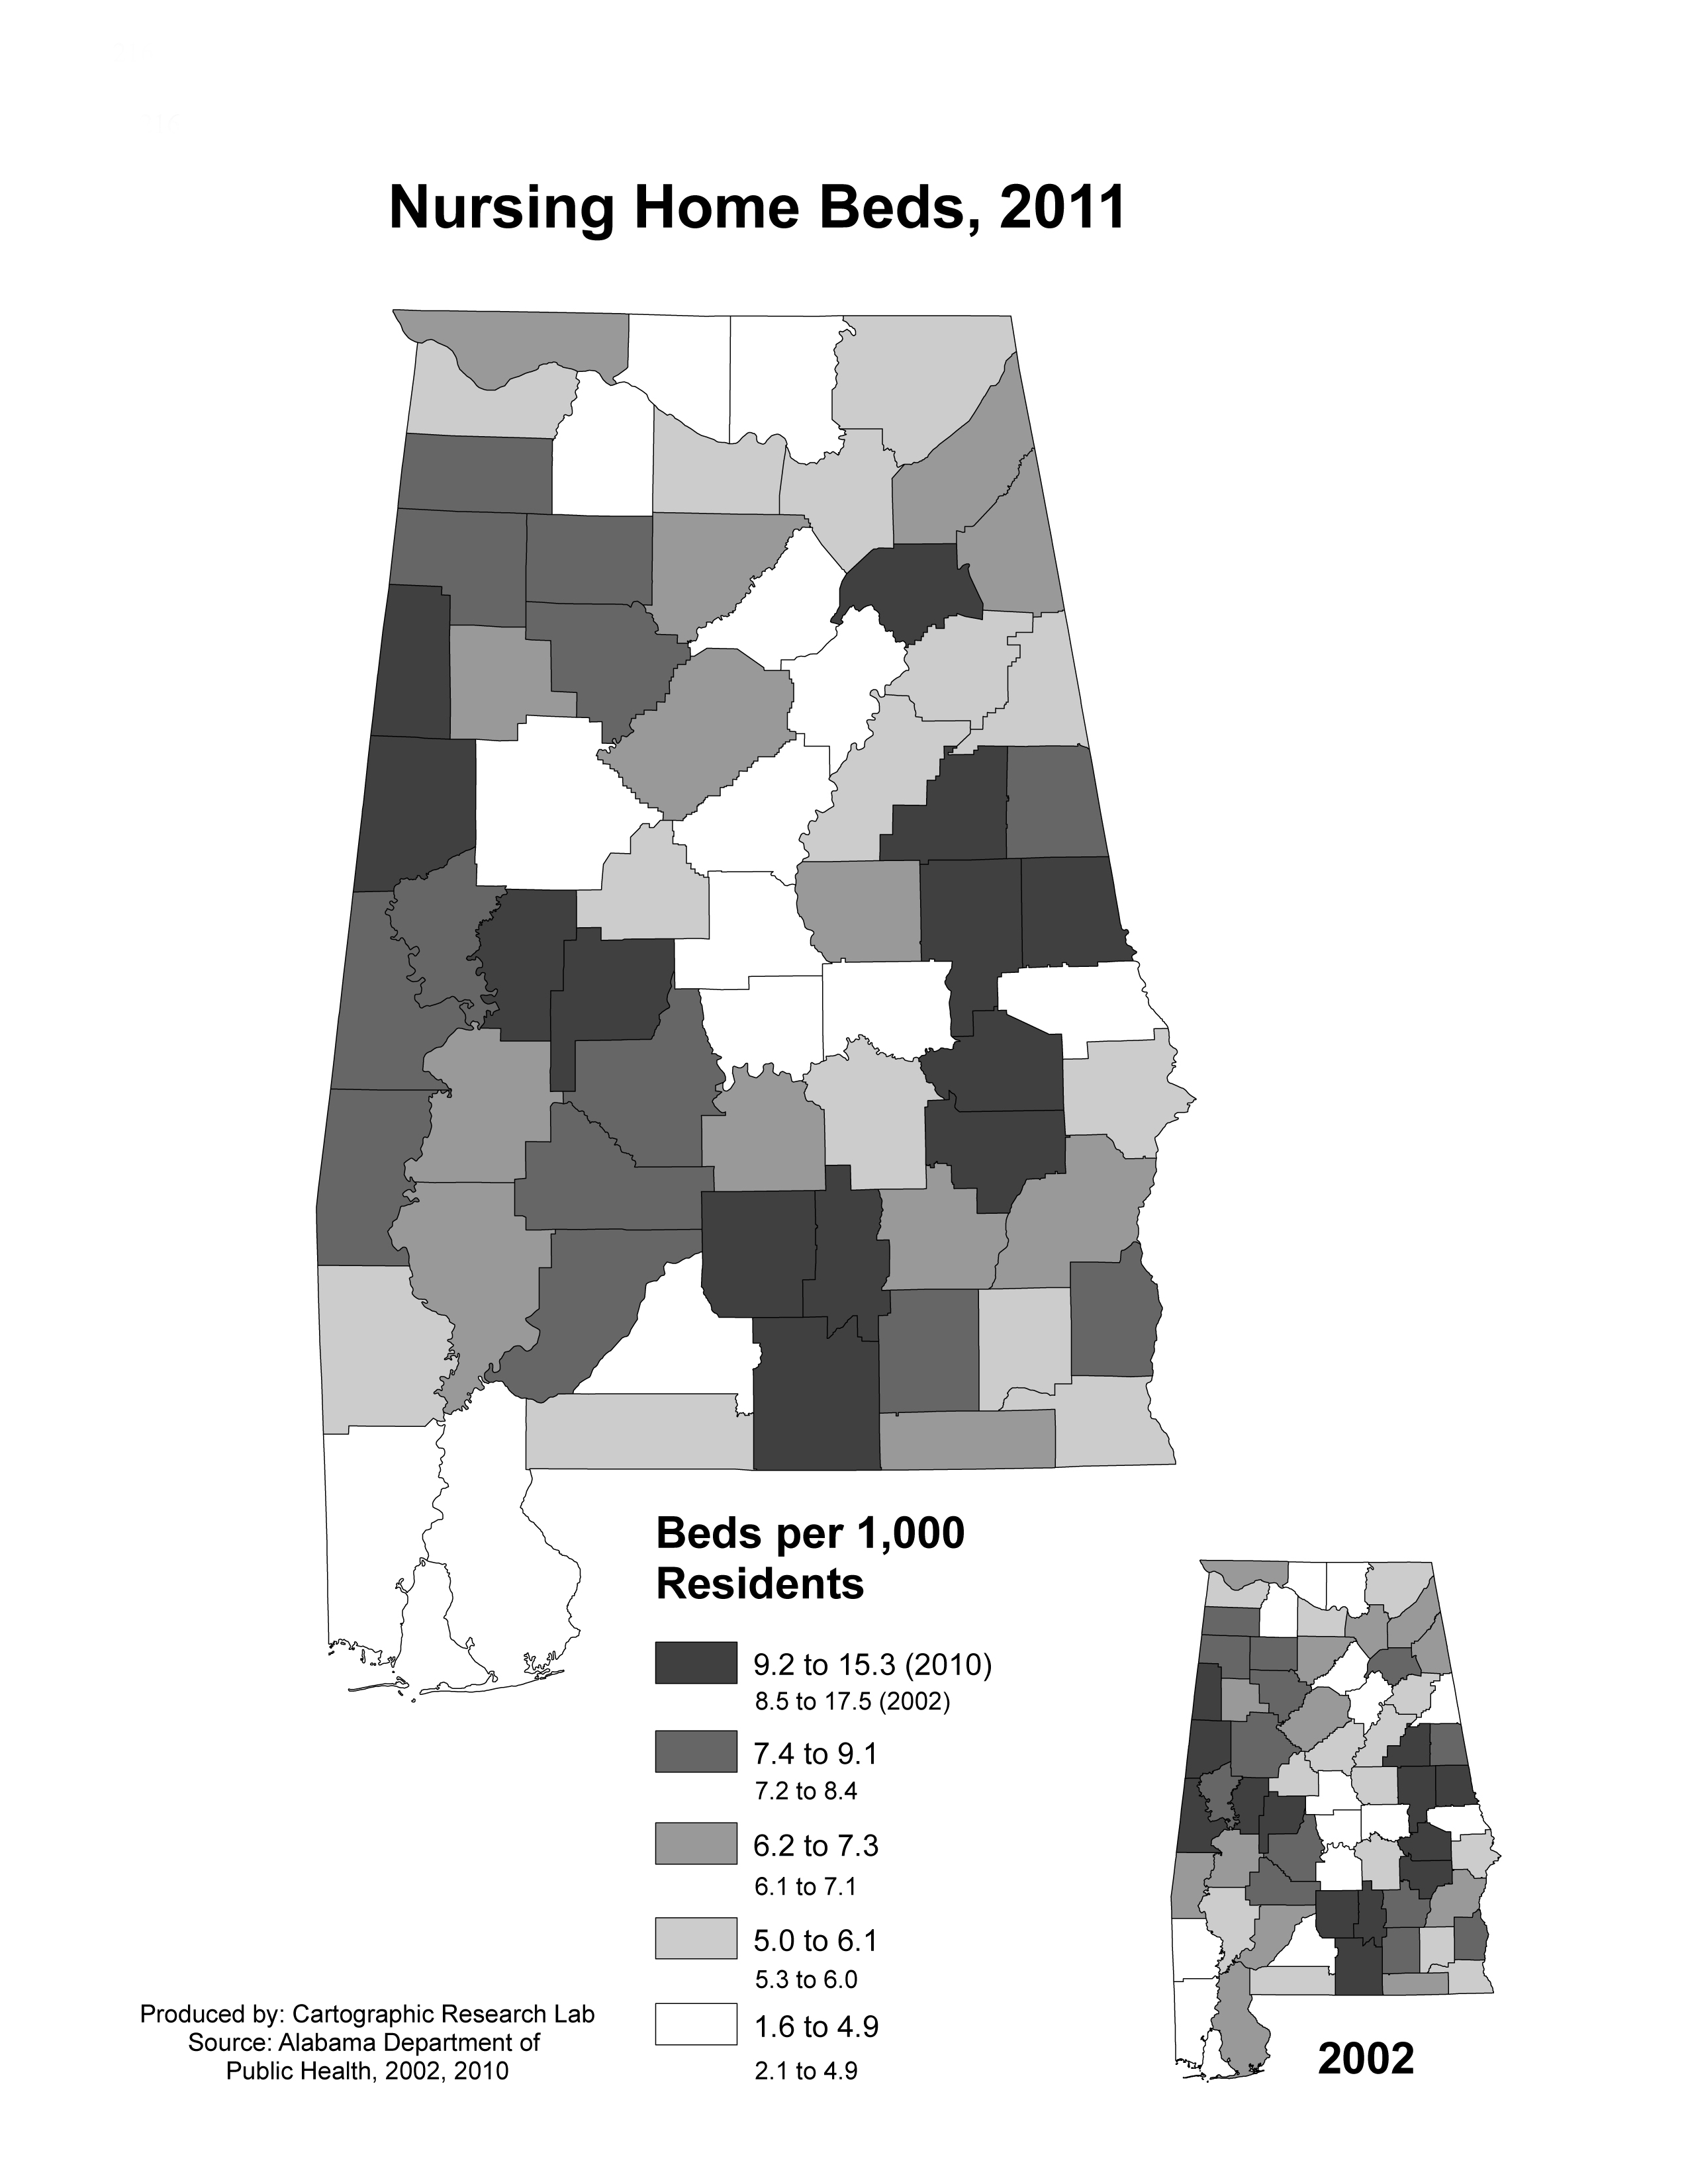
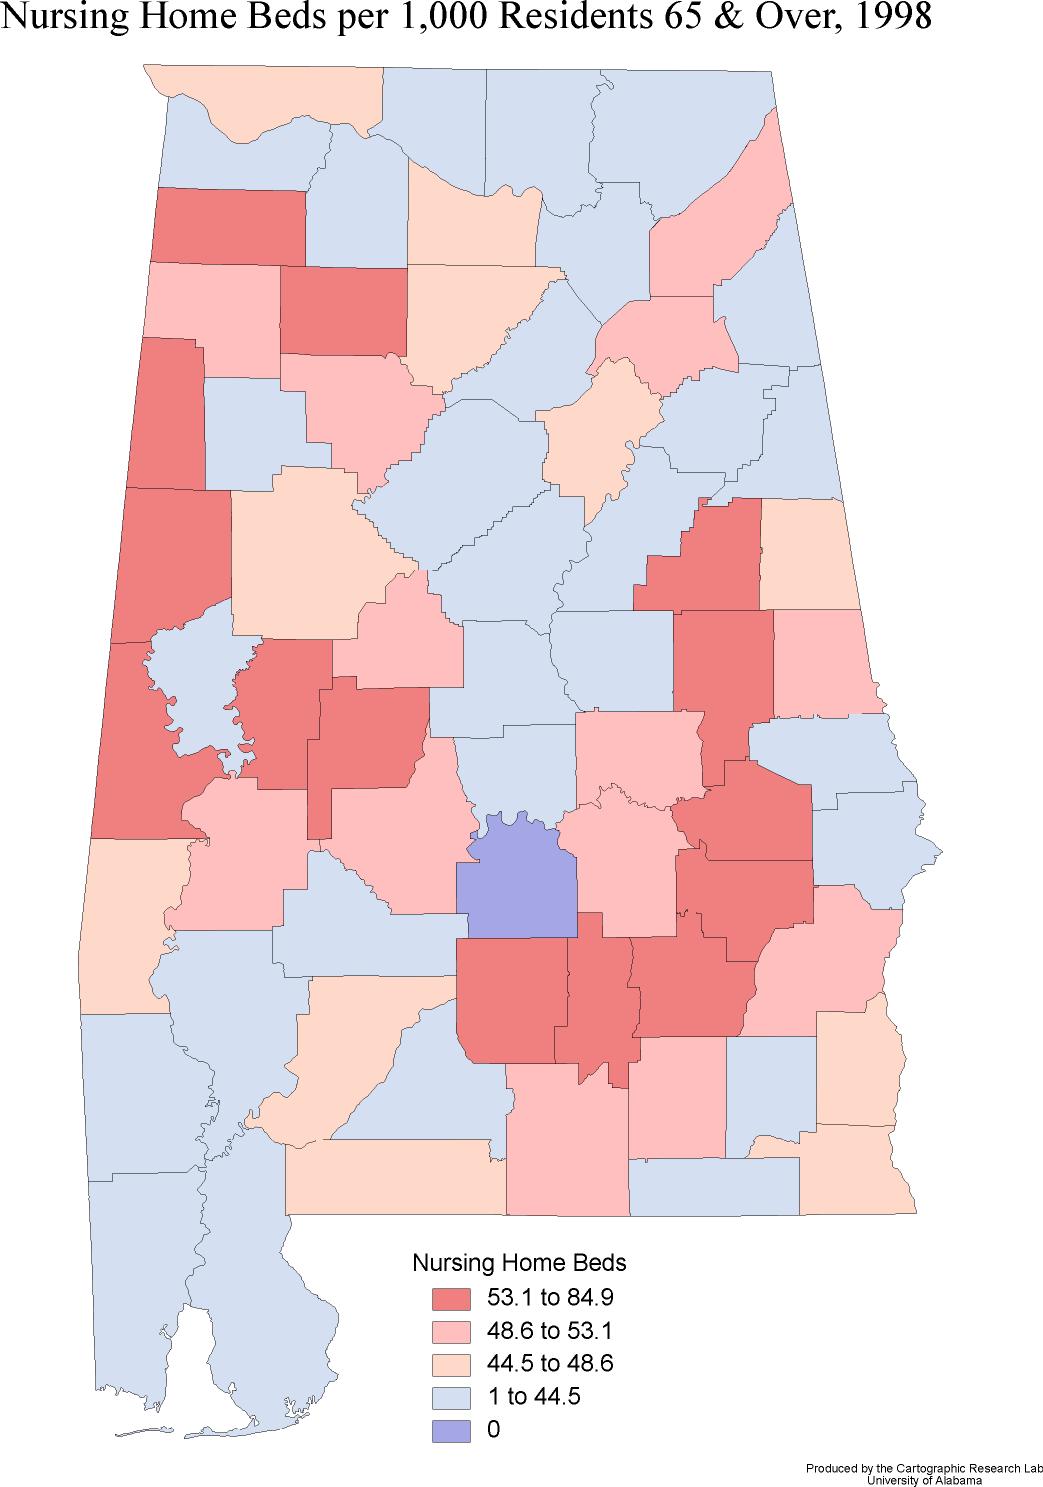
| Nursing
Home Beds per 1,000 Residents aged 65 and over, 1998 |
| 
|
|
|
|
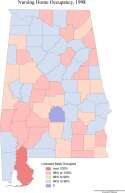
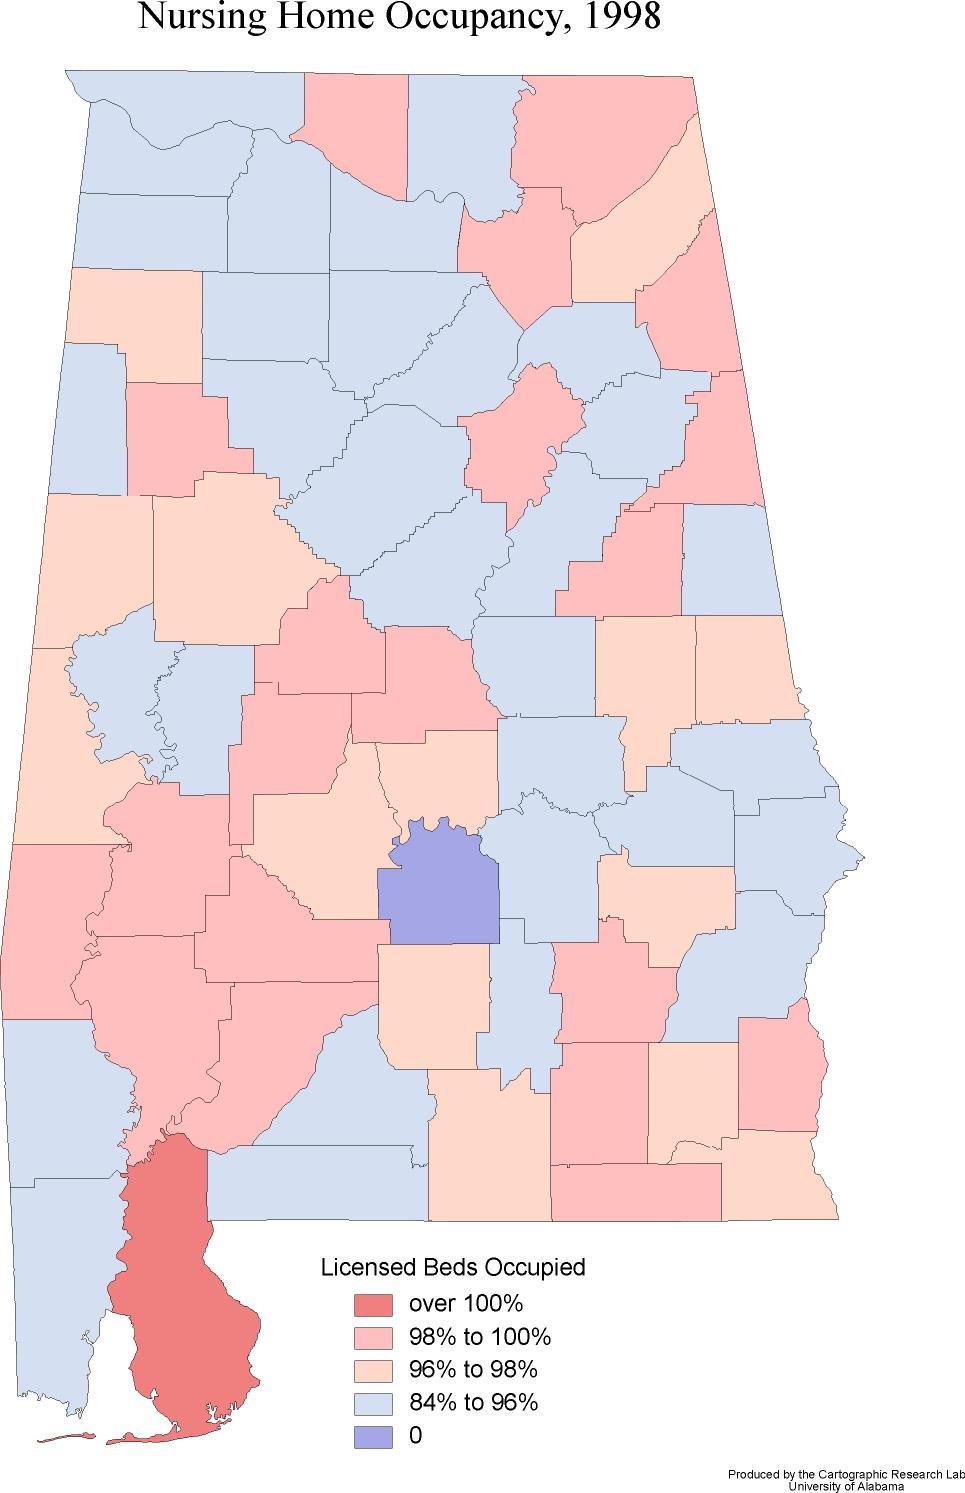
| Nursing
Home Occupancy, 1998 |
| 
|
|
|
|
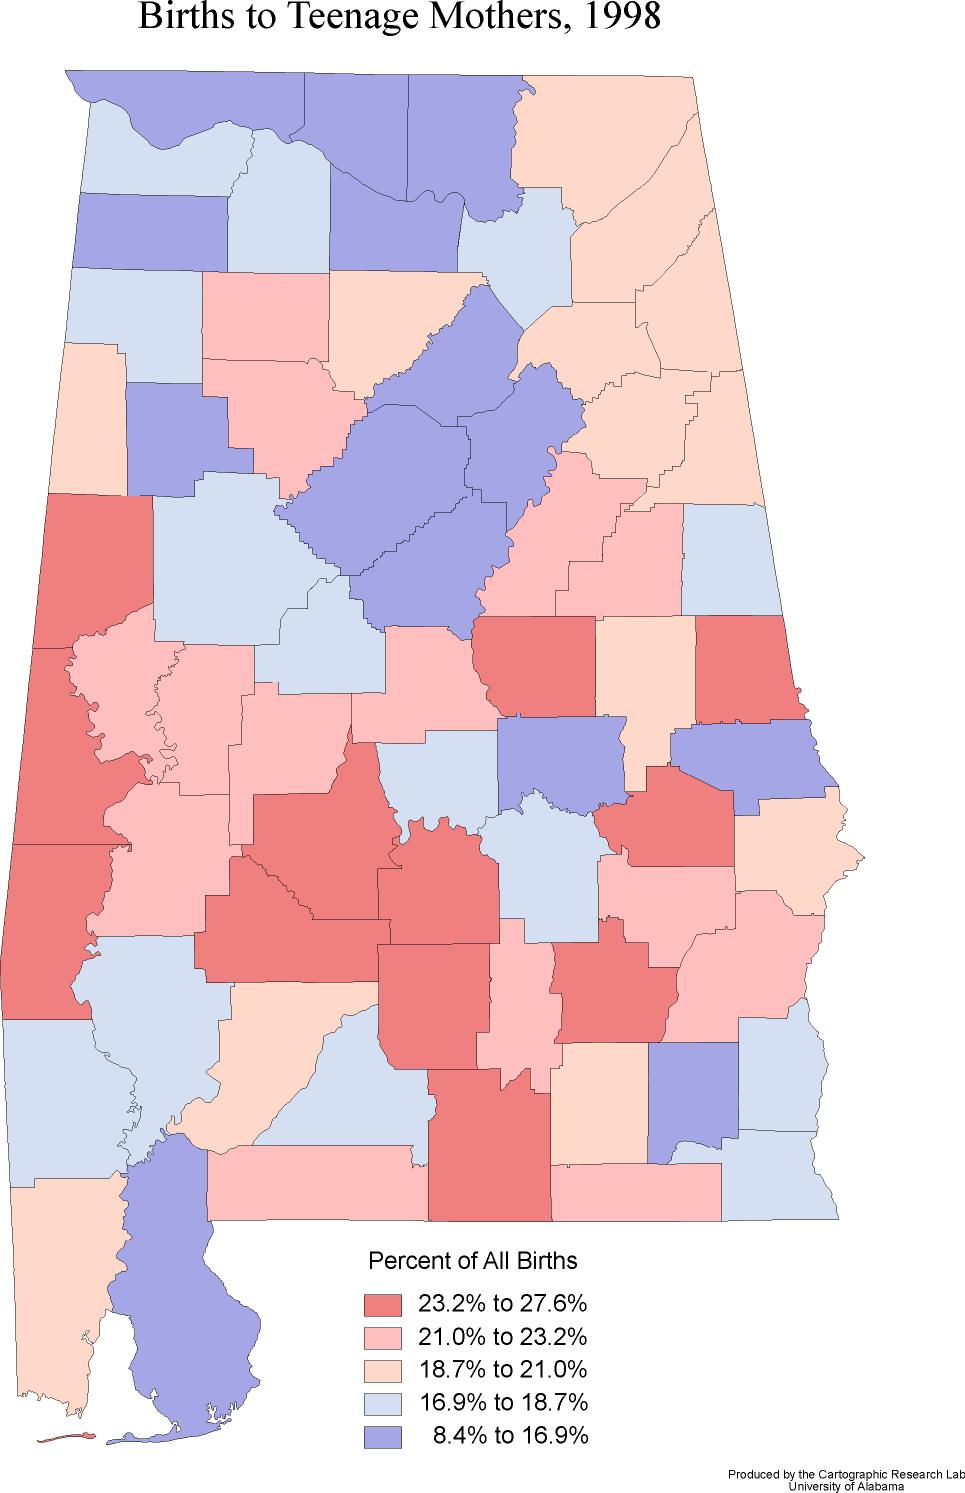
| Births
to Teenage Mothers, 1998 |
| 
|
|
|
|
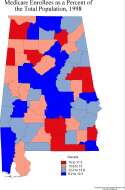
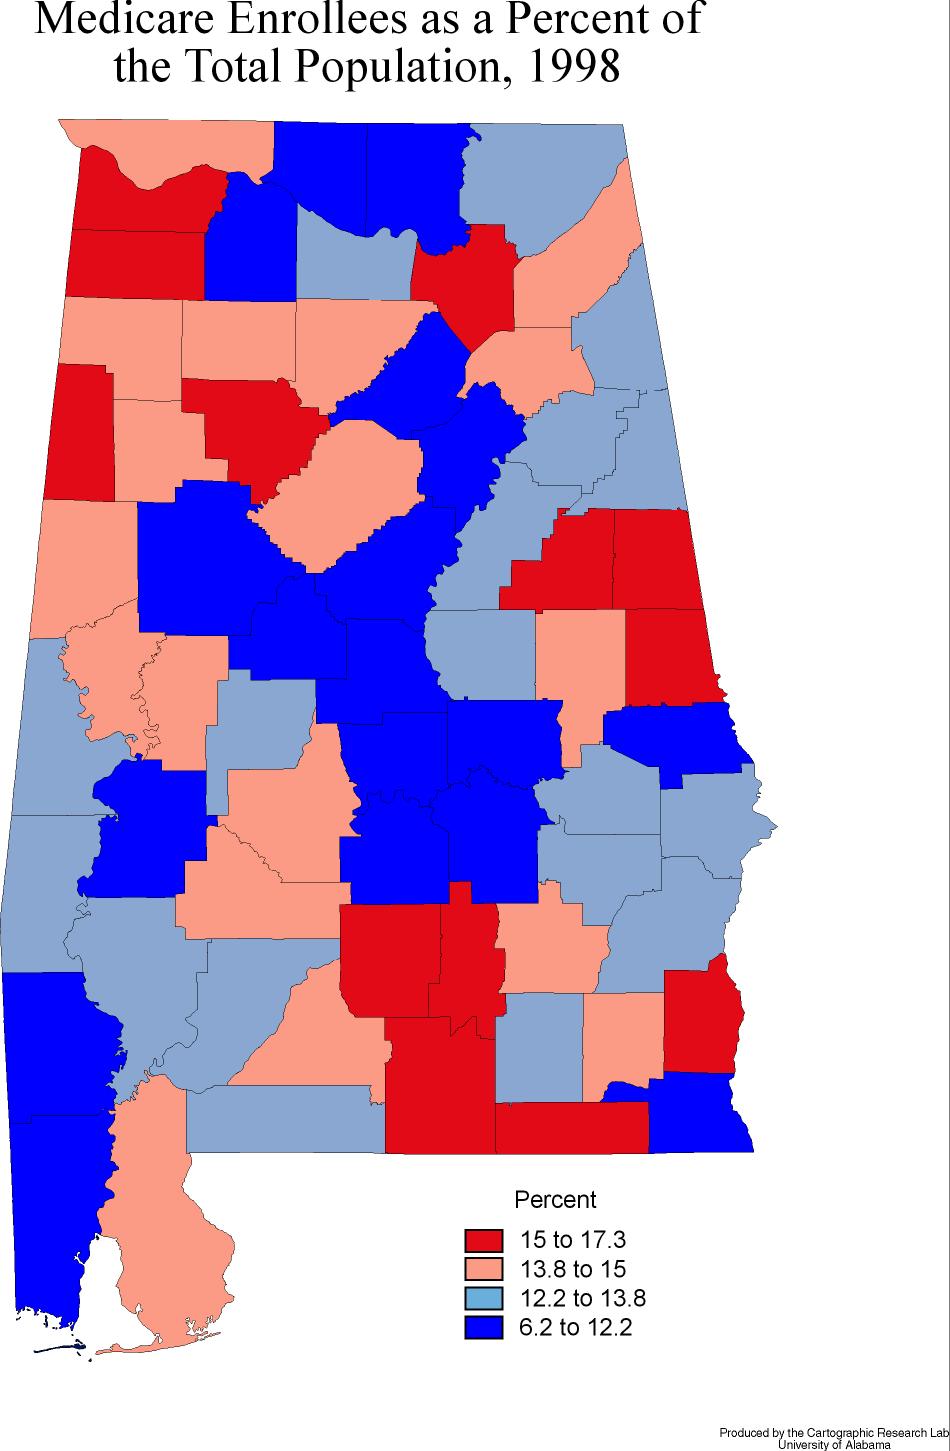
| Medicare
Enrollees as a Percent of the Total Population, 1998 |
| 
|
|
|
|
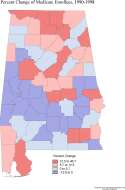
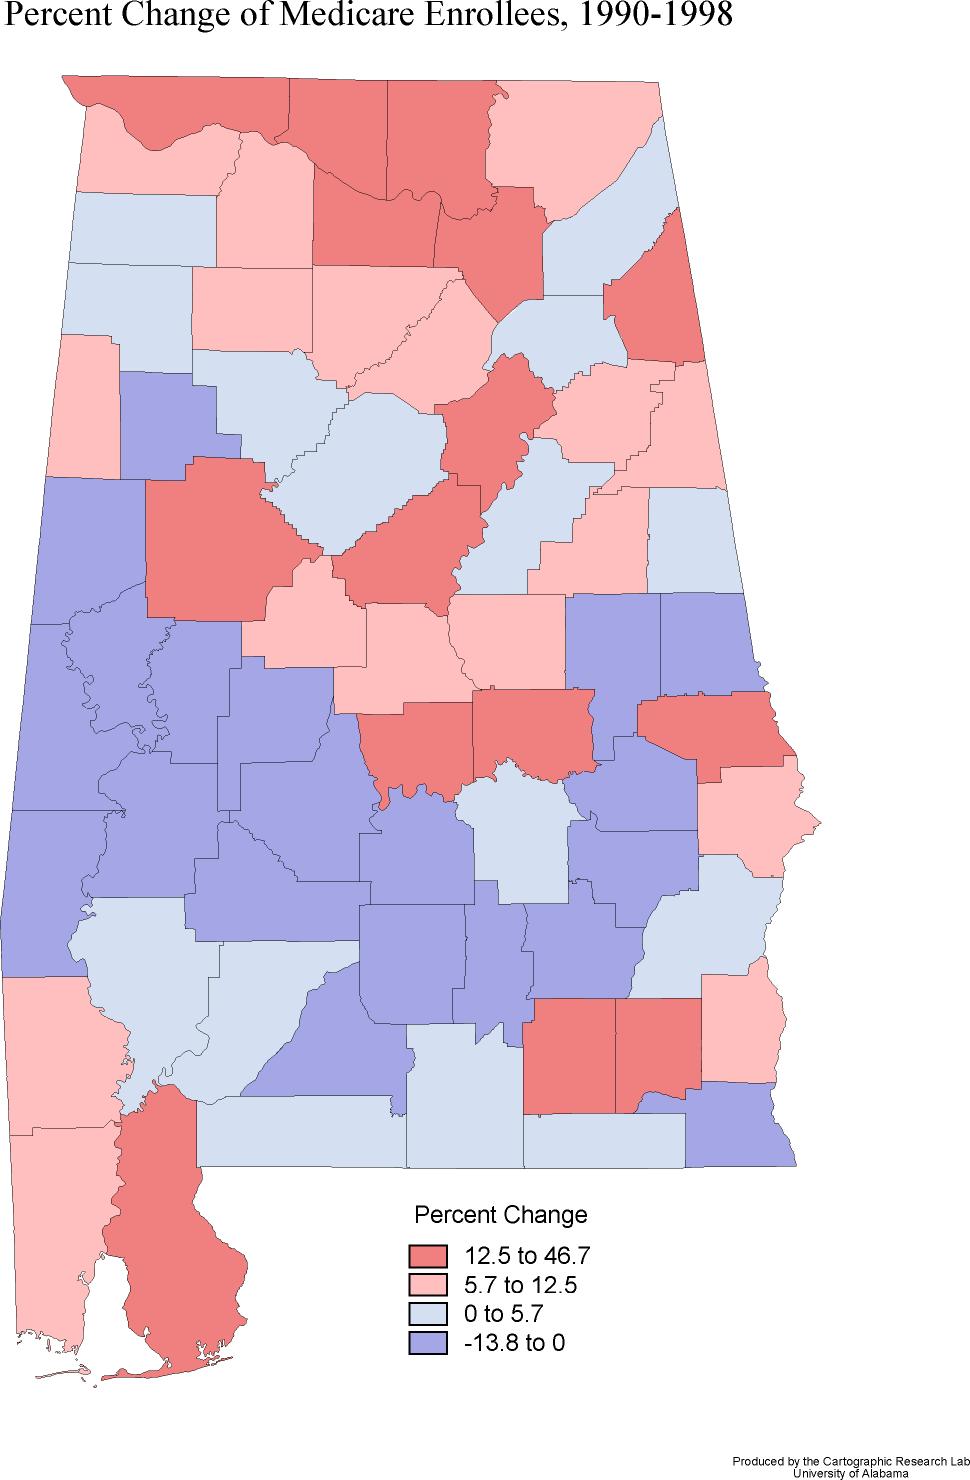
| Percent
Change of Medicare enrollees, 1990-1998 |
| 
|
|
|


