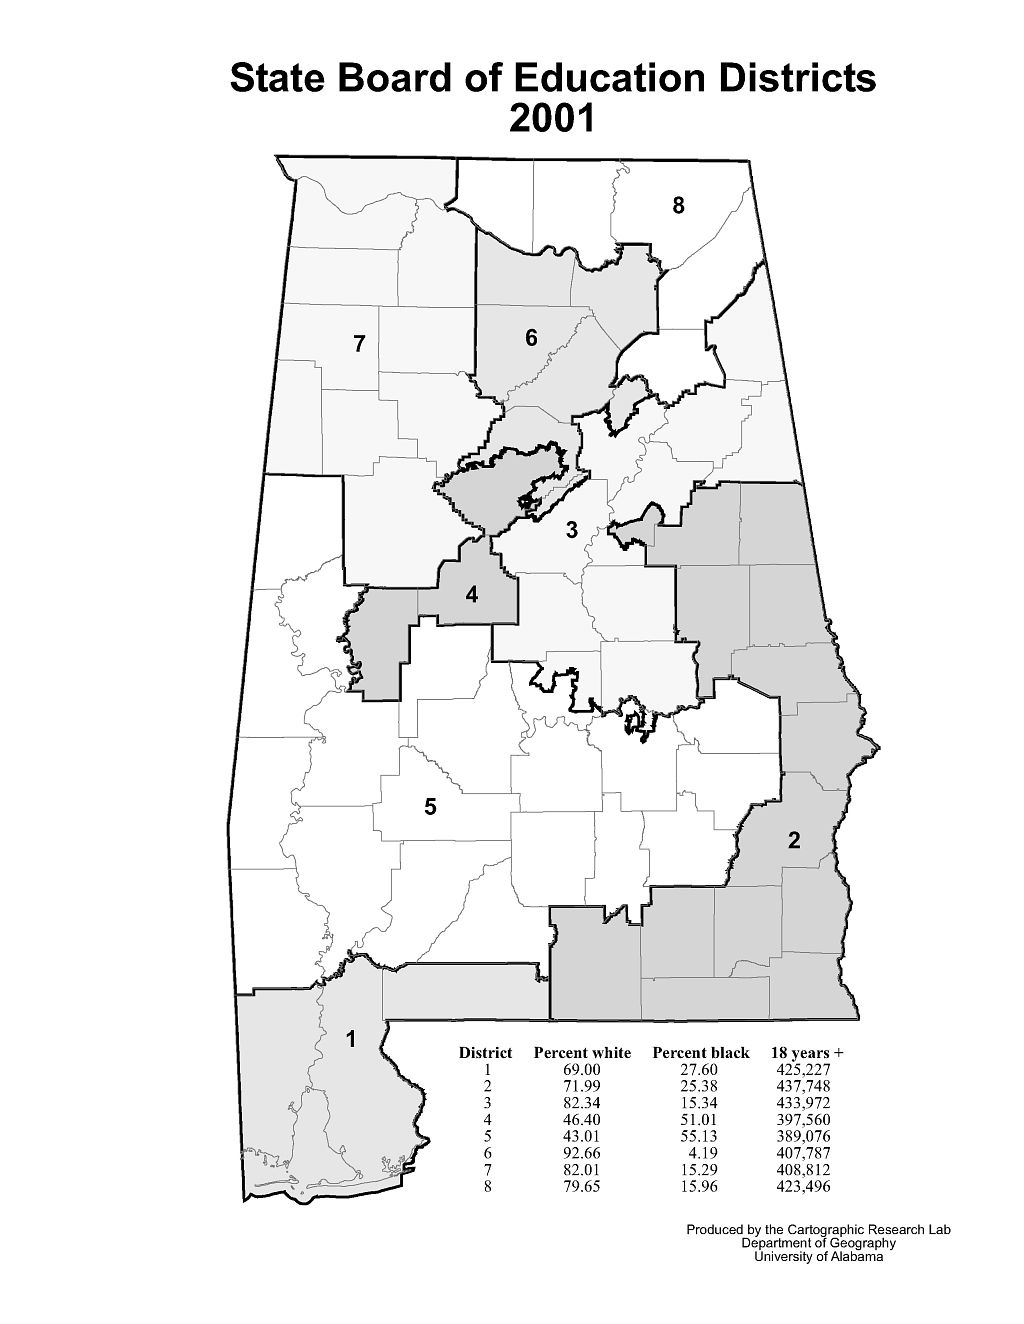
| State
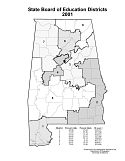
Board of Education Districts, 2001 |
 |
Format:  PDF  427kb
         JPEG 108kb
State Board of Education Districts, 2001. |
|
|
|
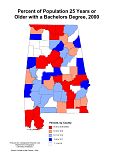
| Percent
of Population 25 Years or Older with a Bachelor's Degree, 2000 |
 |
Format:  PDF   60kb
         JPEG 100kb
Percent of Population 25 Years or Older with a Bachelor's
Degree, 2000. |
|
|
|
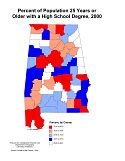
| Percent
of Population 25 Years or Older with a High School Degree, 2000 |
 |
Format:  PDF  60kb
         JPEG 90kb
Percent of Population 25 Years or Older with a High School
Degree, 2000. |
|
|
|
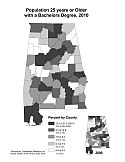
| Percent
of Population 25 Years or Older with a Bachelor's Degree, 2010 |
 |
Format:  PDF
         JPEG
Percent of Population 25 Years or Older with a Bachelor's
Degree, 2010. |
|
|
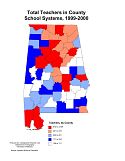
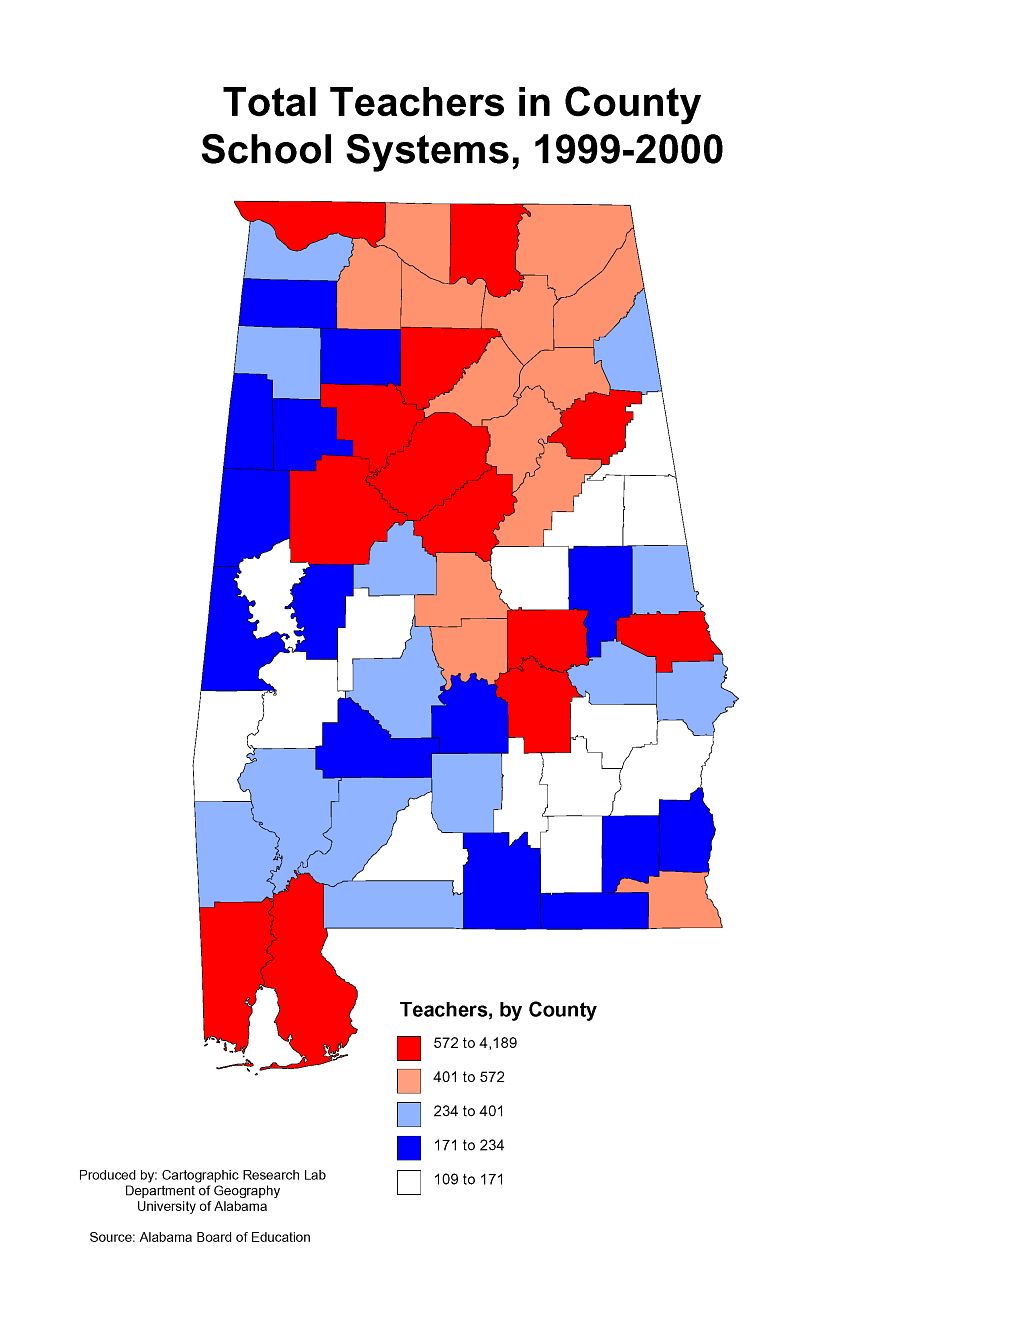
| Total
Teachers in County School Systems, 1999-2000 |
 |
Format:  PDF  60kb
         JPEG 96kb
Total Teachers in County School Systems, 1999-2000. |
|
|
|
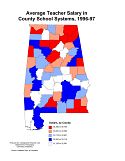
| Average
Teacher Salary in County School System, 1996-97 |
 |
Format:  PDF  60kb
         JPEG 98kb
Average Teacher Salary in County School System, 1996-97. |
|
|
|
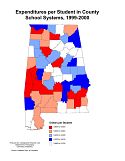
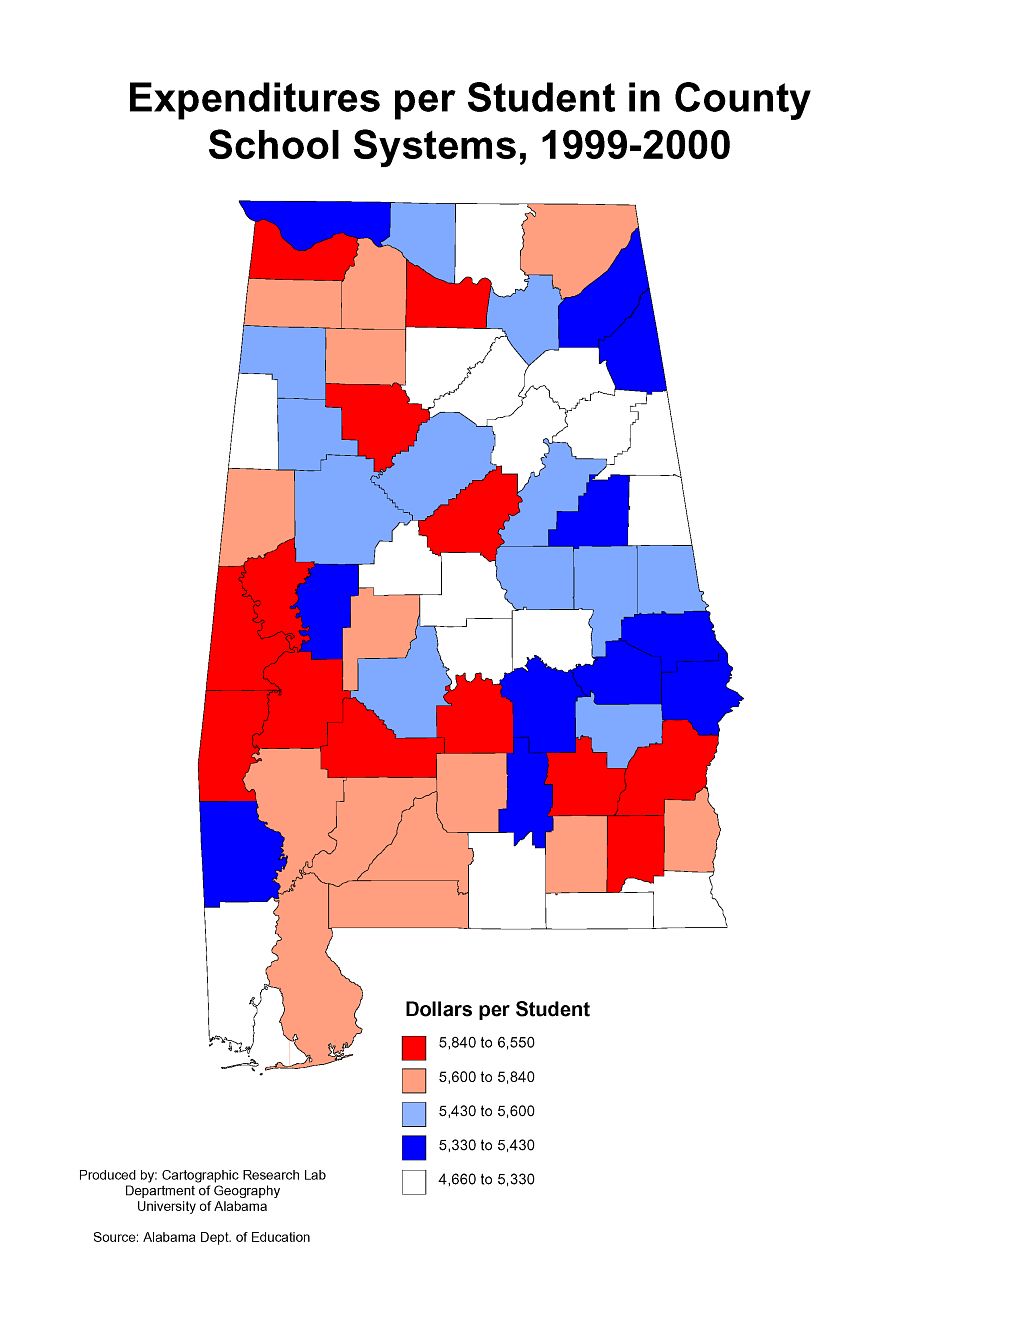
| Expenditures
per Student in County School Systems, 1999-2000 |
 |
Format:  PDF  60kb
         JPEG 97kb
Expenditures per Student in County School Systems, 1999-2000. |
|
|
|
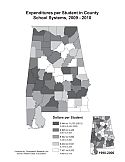
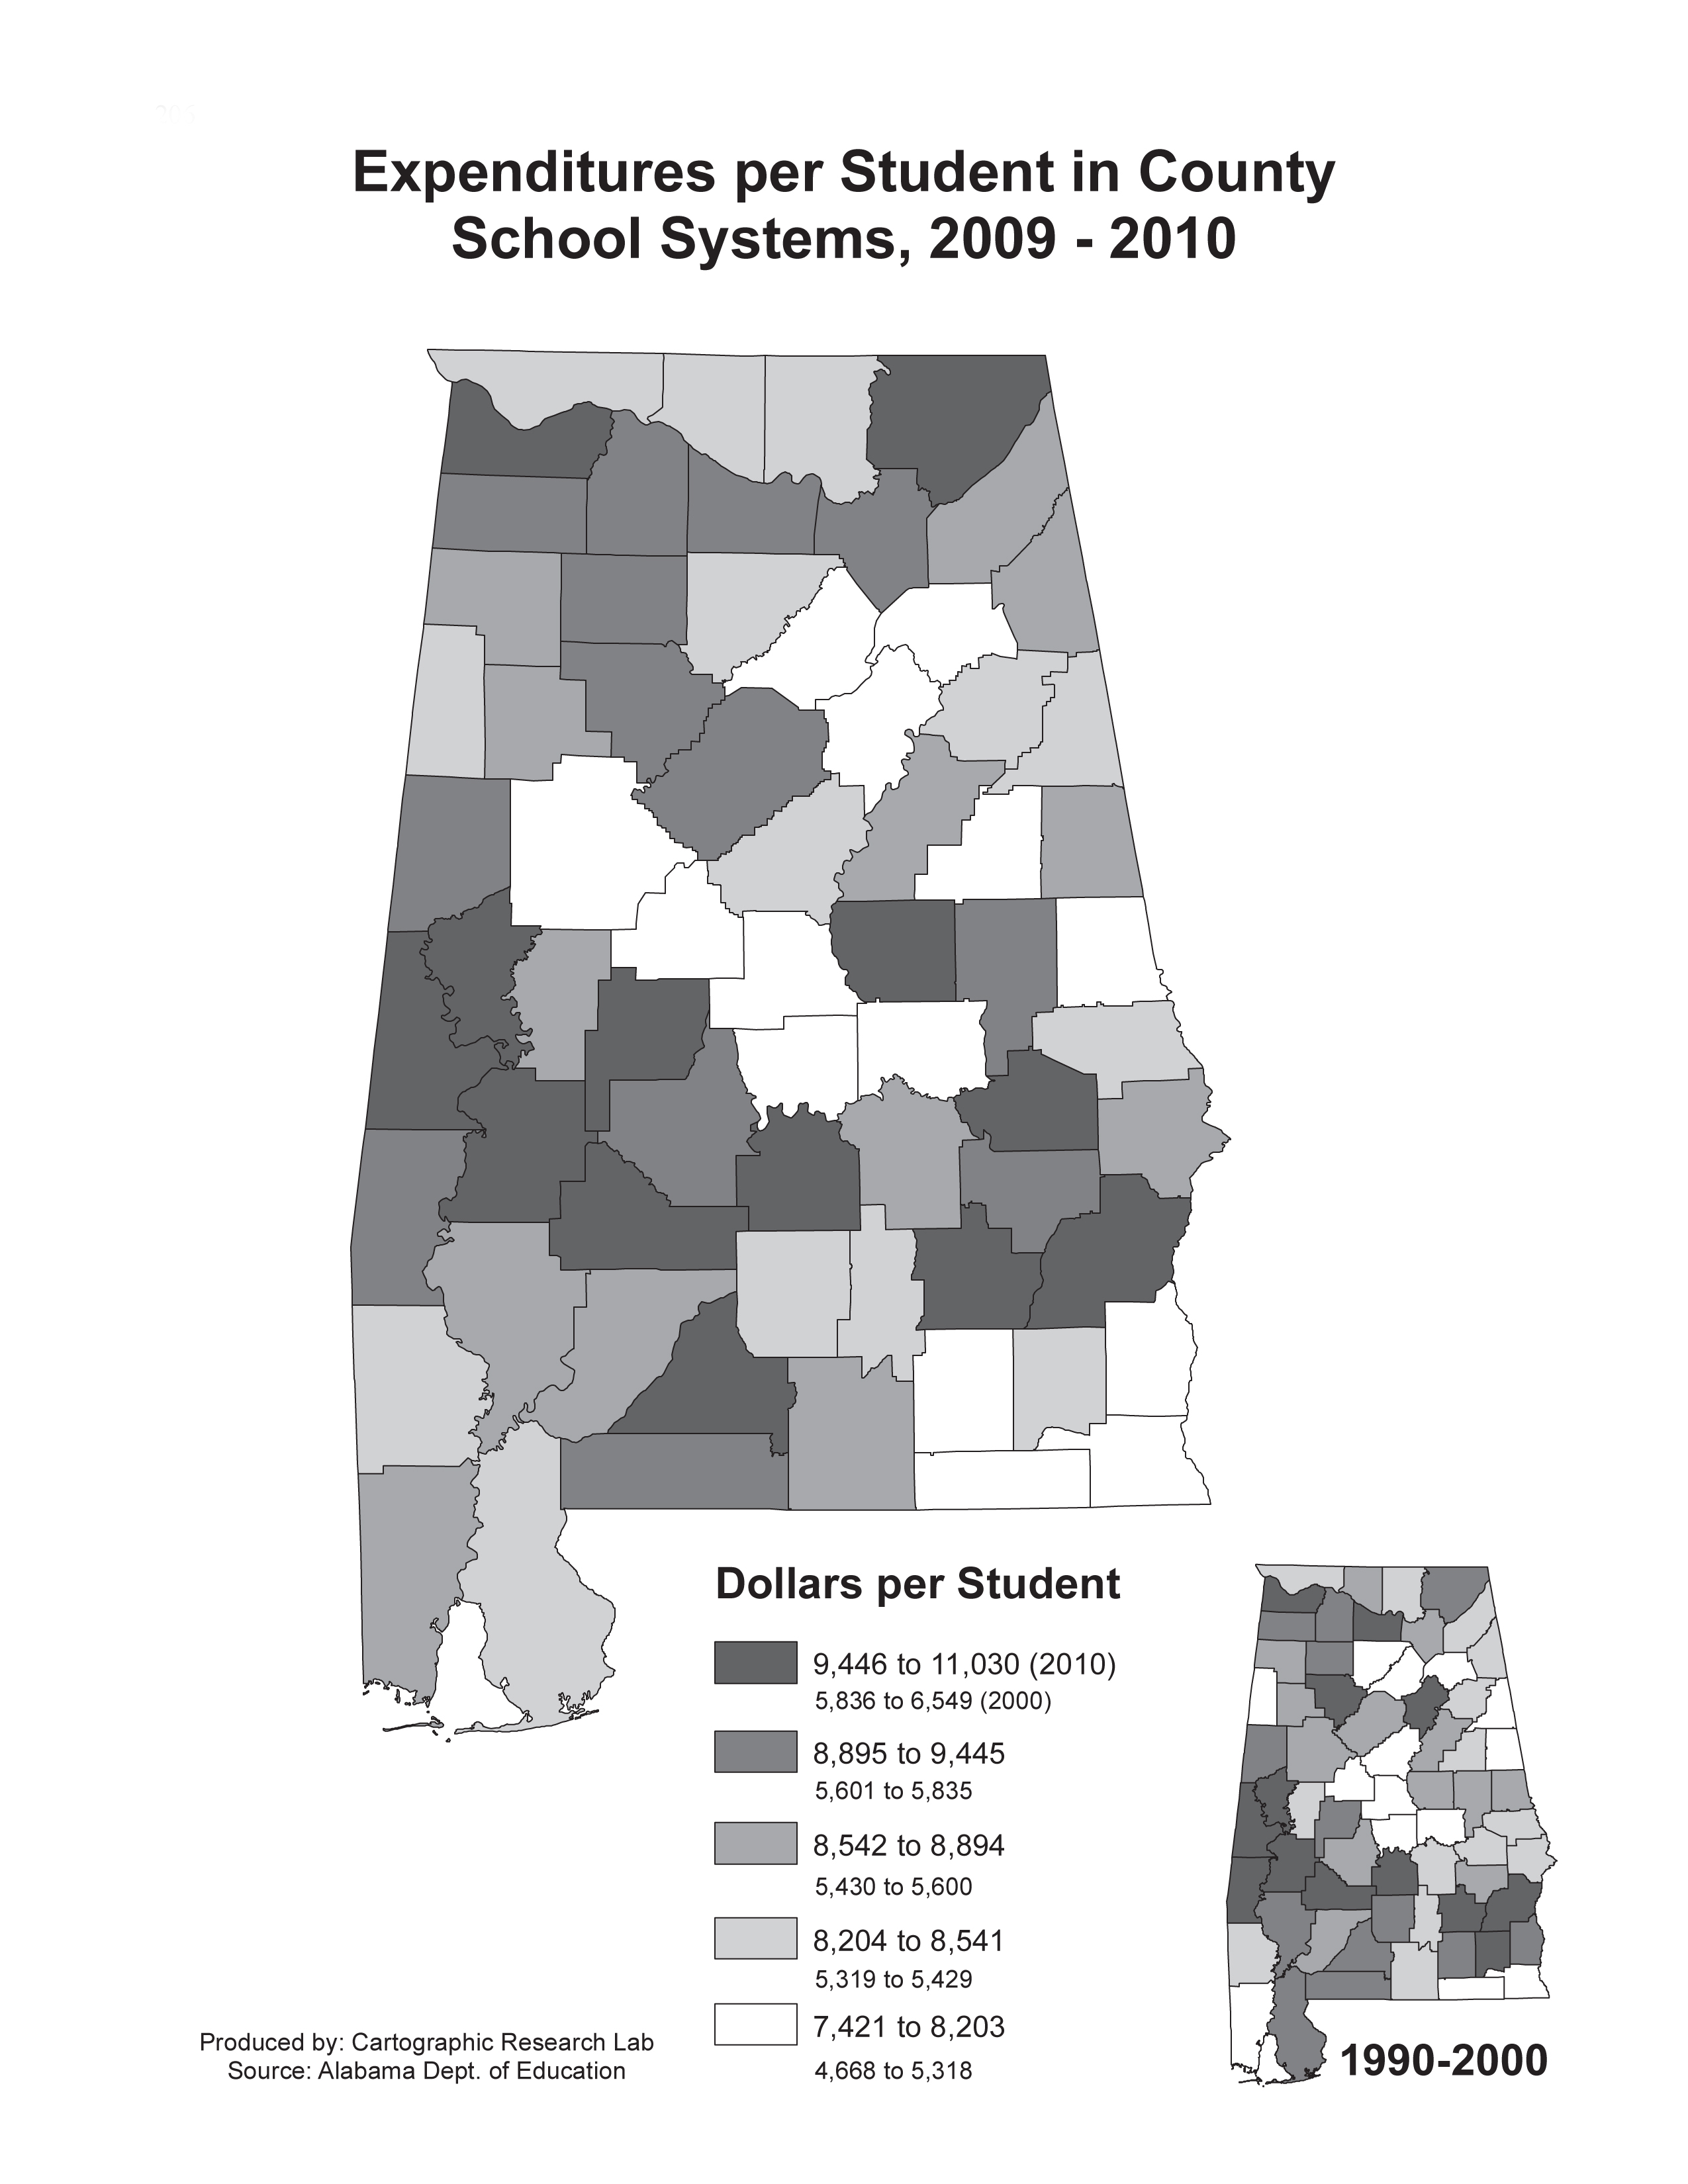
| Expenditures
per Student in County School Systems, 2009-2010 |
 |
Format:  PDF
         JPEG
Expenditures per Student in County School Systems, 2009-2010. |
|
|
|
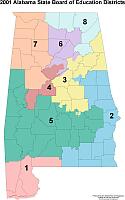
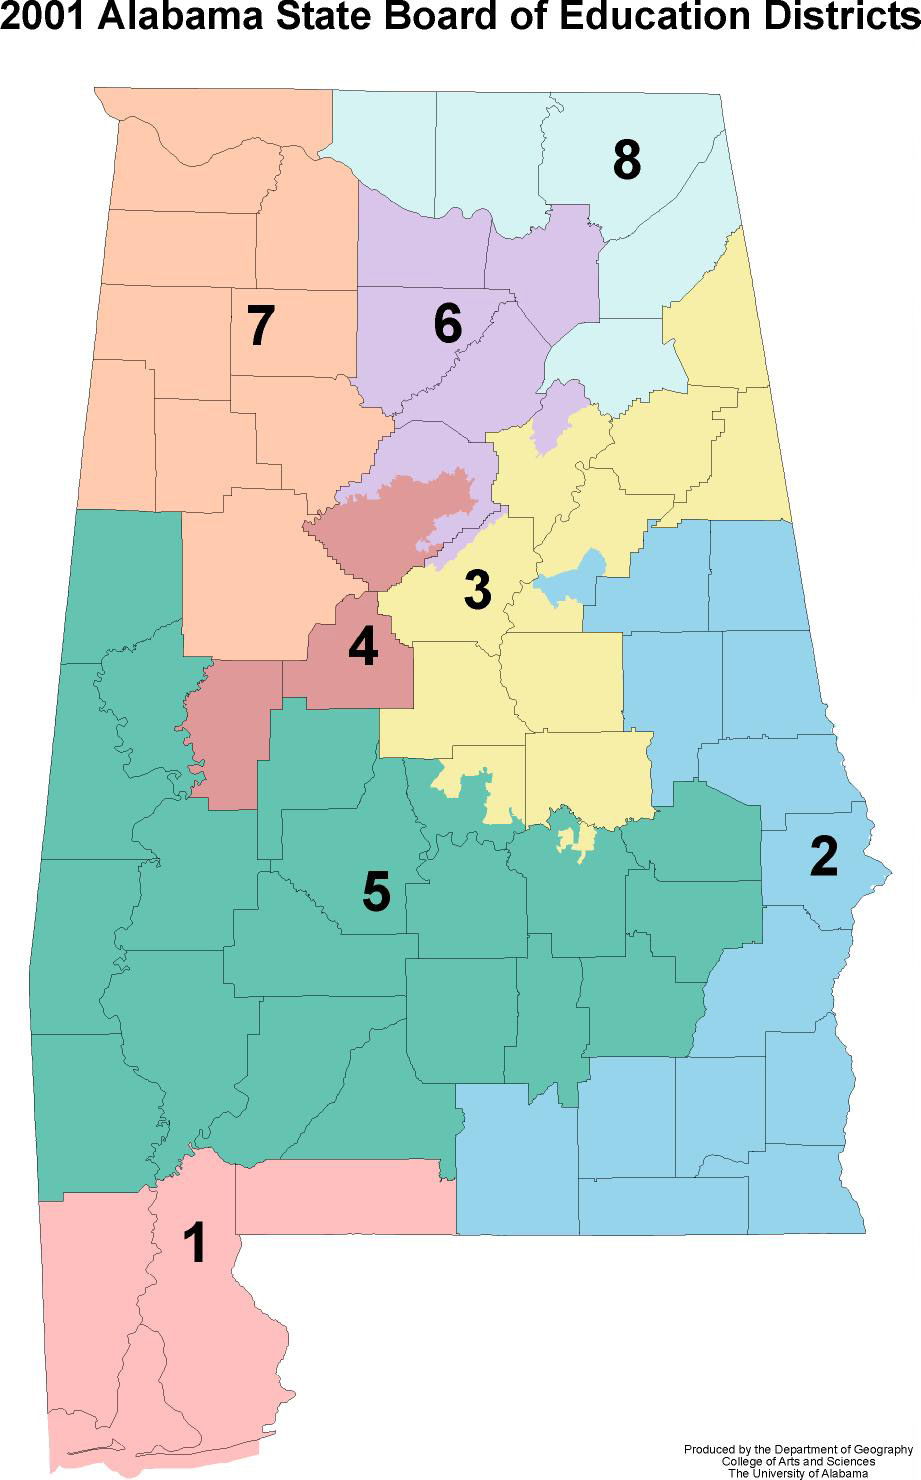
| 2001
Alabama State Board of Education Districts |
|
| |
Format:  PDF  179kb
JPEG 109kb |
| |
| State Board of Education districts, 2001. |
|
|
|
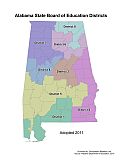
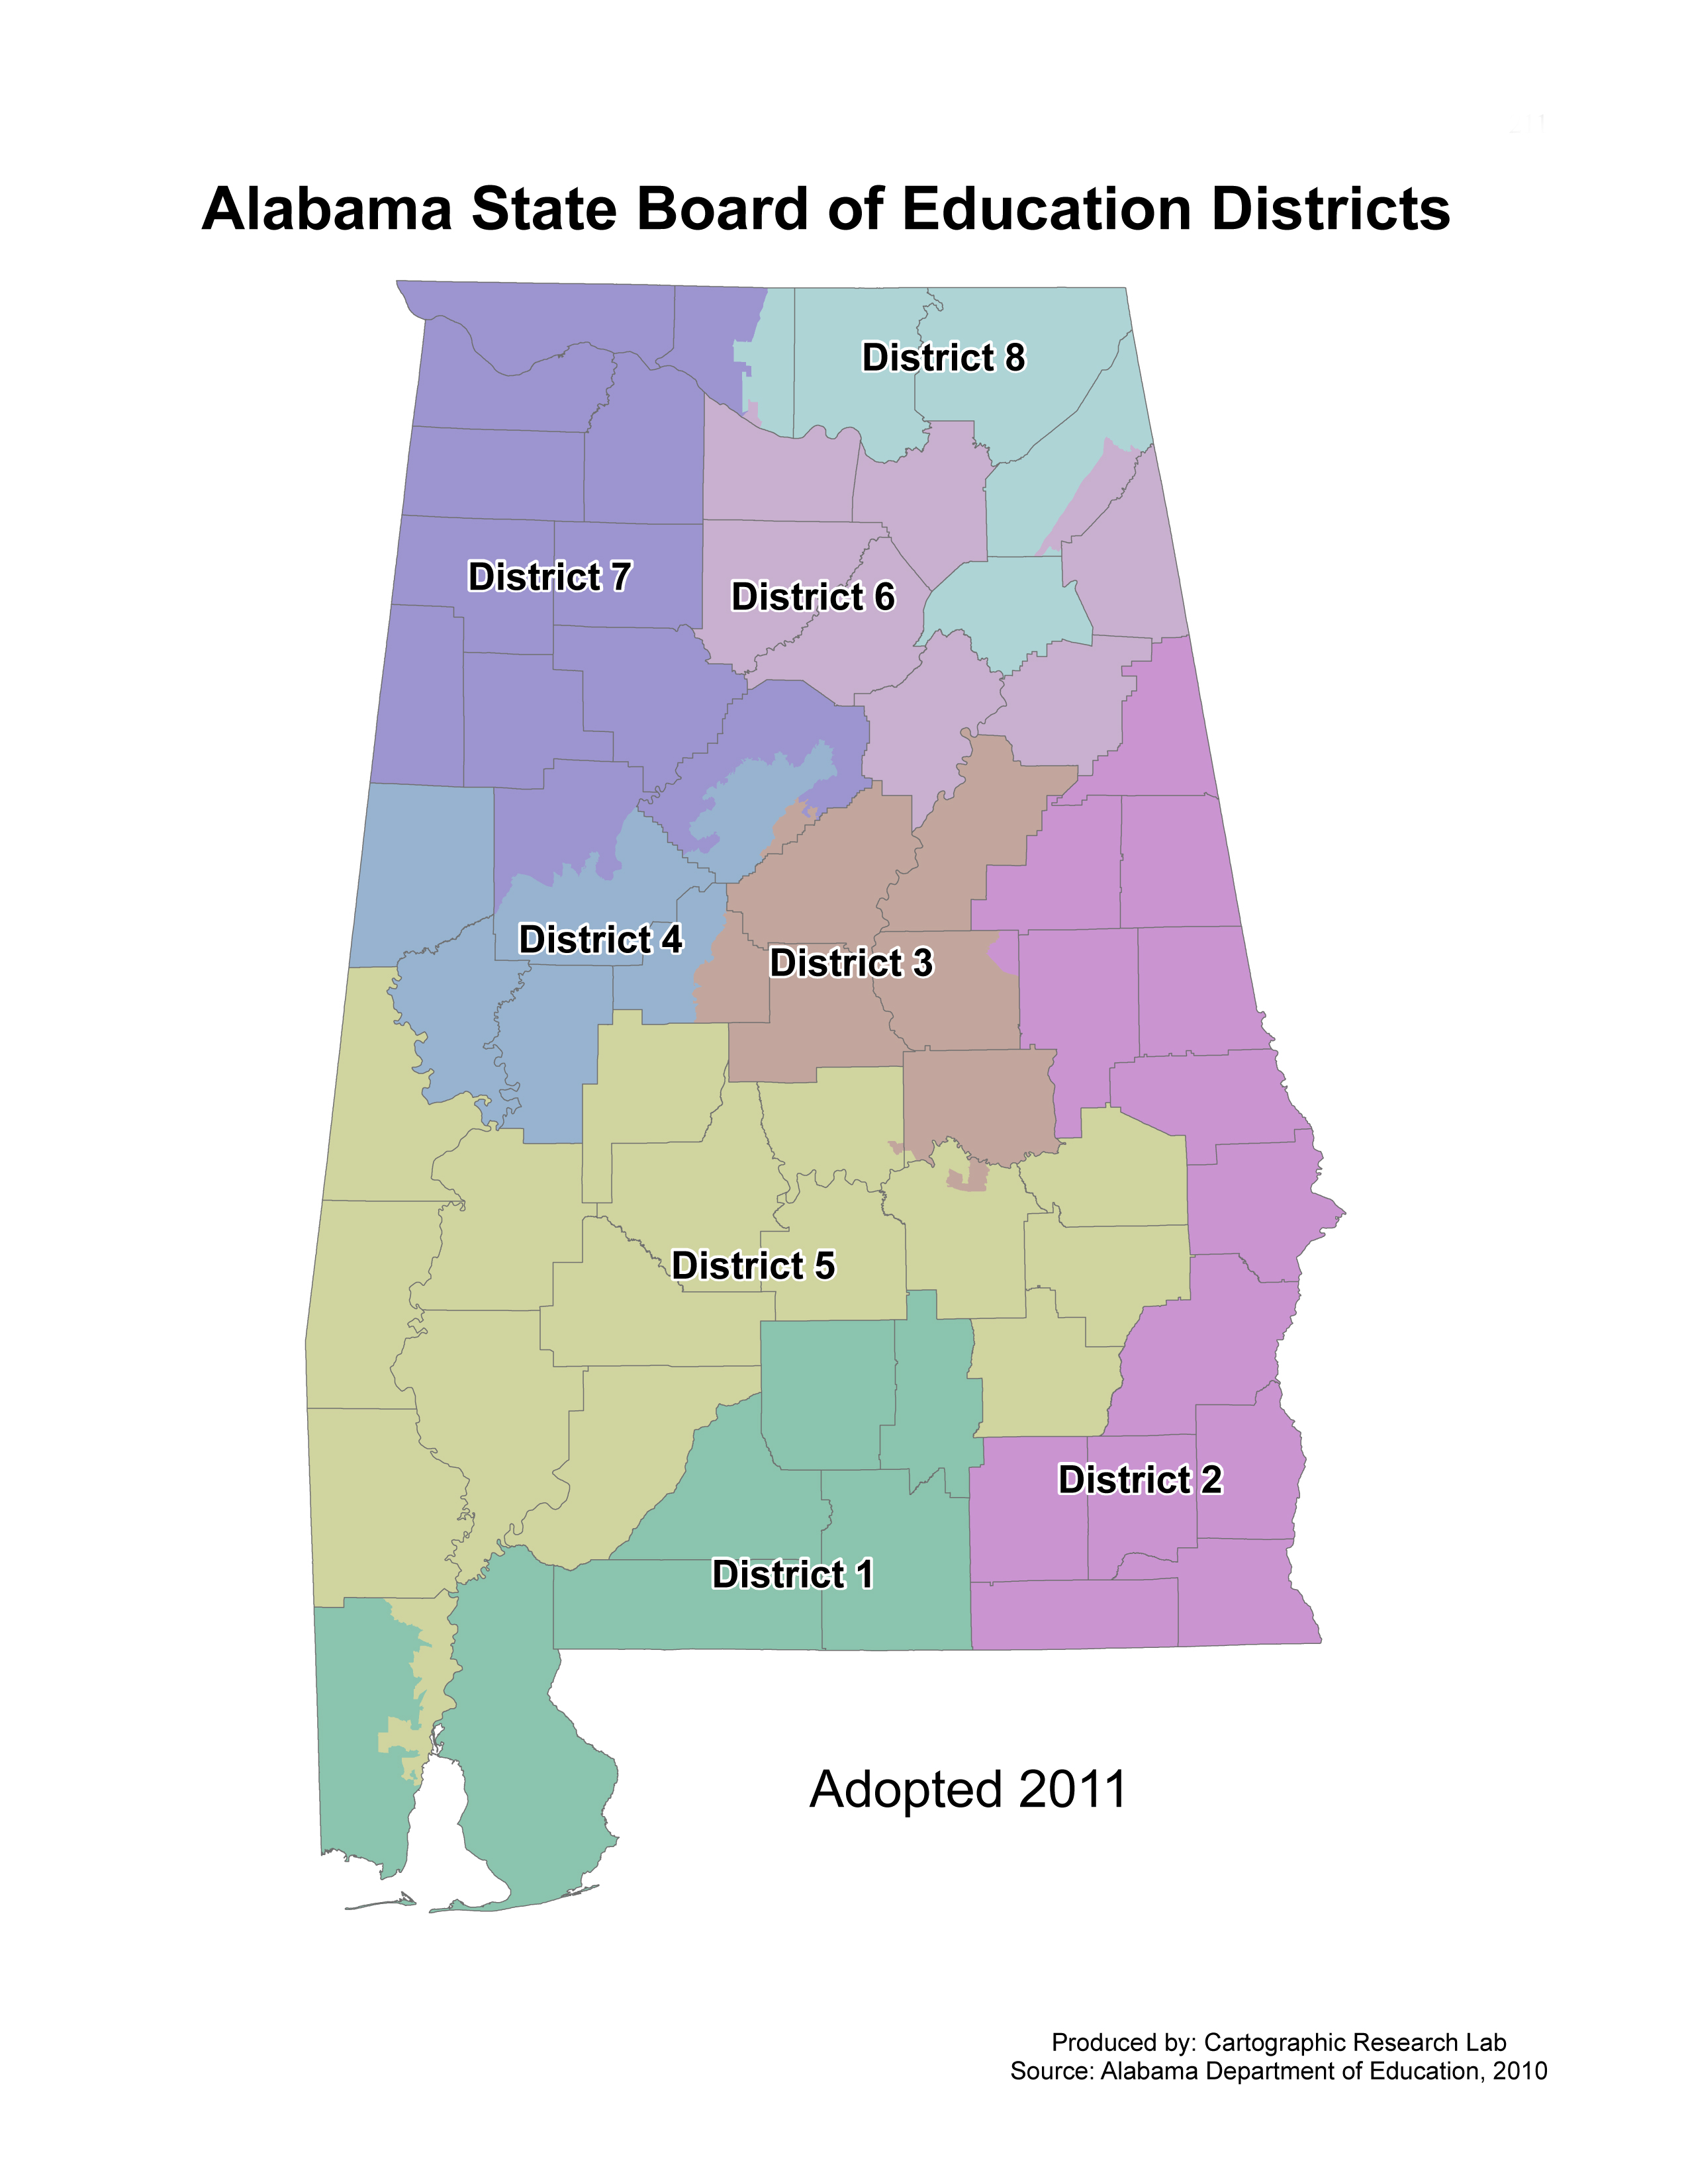
| 2011
Alabama State Board of Education Districts |
|
| |
Format:  PDF
JPEG |
| |
| State Board of Education districts, Adopted 2011. |
|
|
|
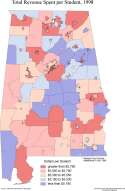
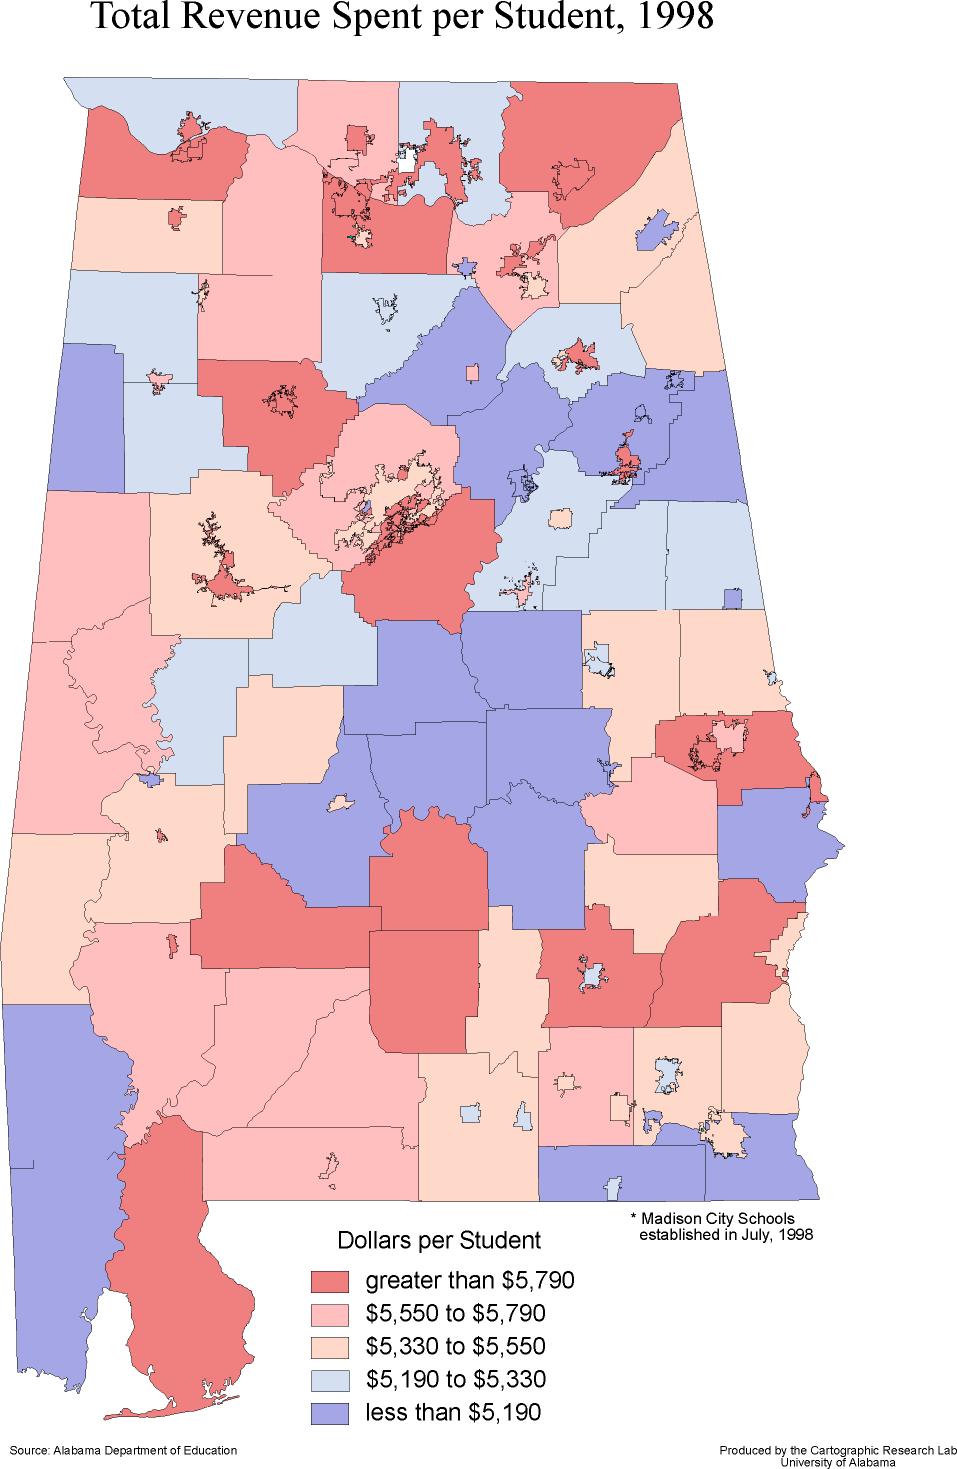
| Total
Revenue Spent by Student, 1998 |
|
| |
Format:  PDF  182kb
JPEG 132kb |
| |
| The total revenue spent per student, 1998. |
|
|
|
|
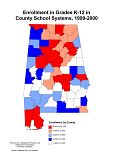
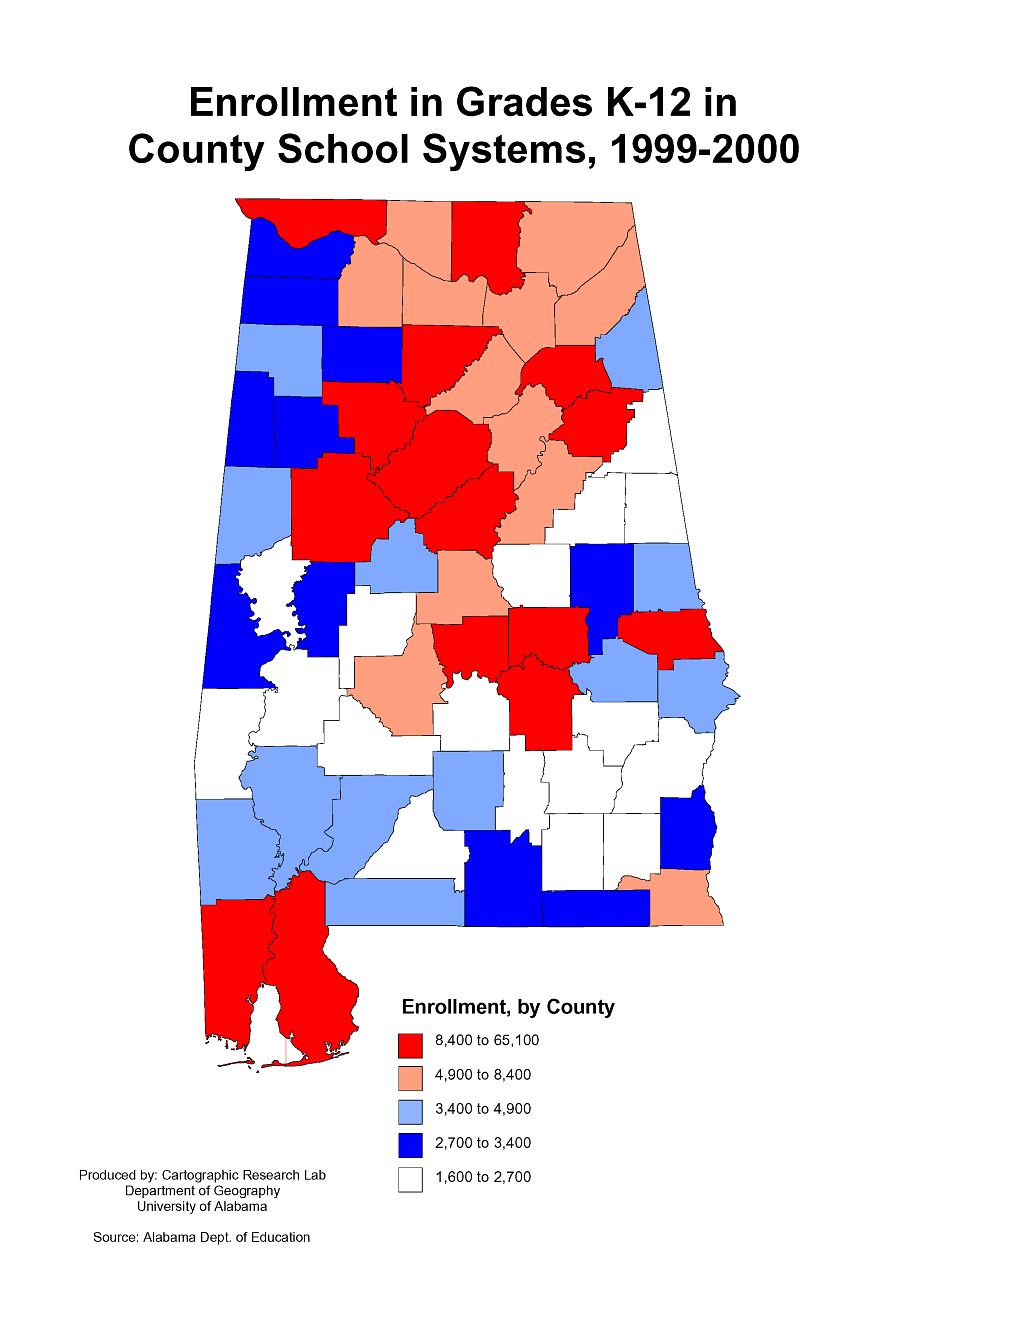
| Enrollment
in Grades K-12 in County School Systems, 1999-2000 |
 |
Format:  PDF   60kb
         JPEG 101kb
Enrollment in Grades K-12 in County School Systems, 1999-2000. |
|
|
|
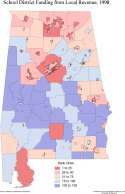
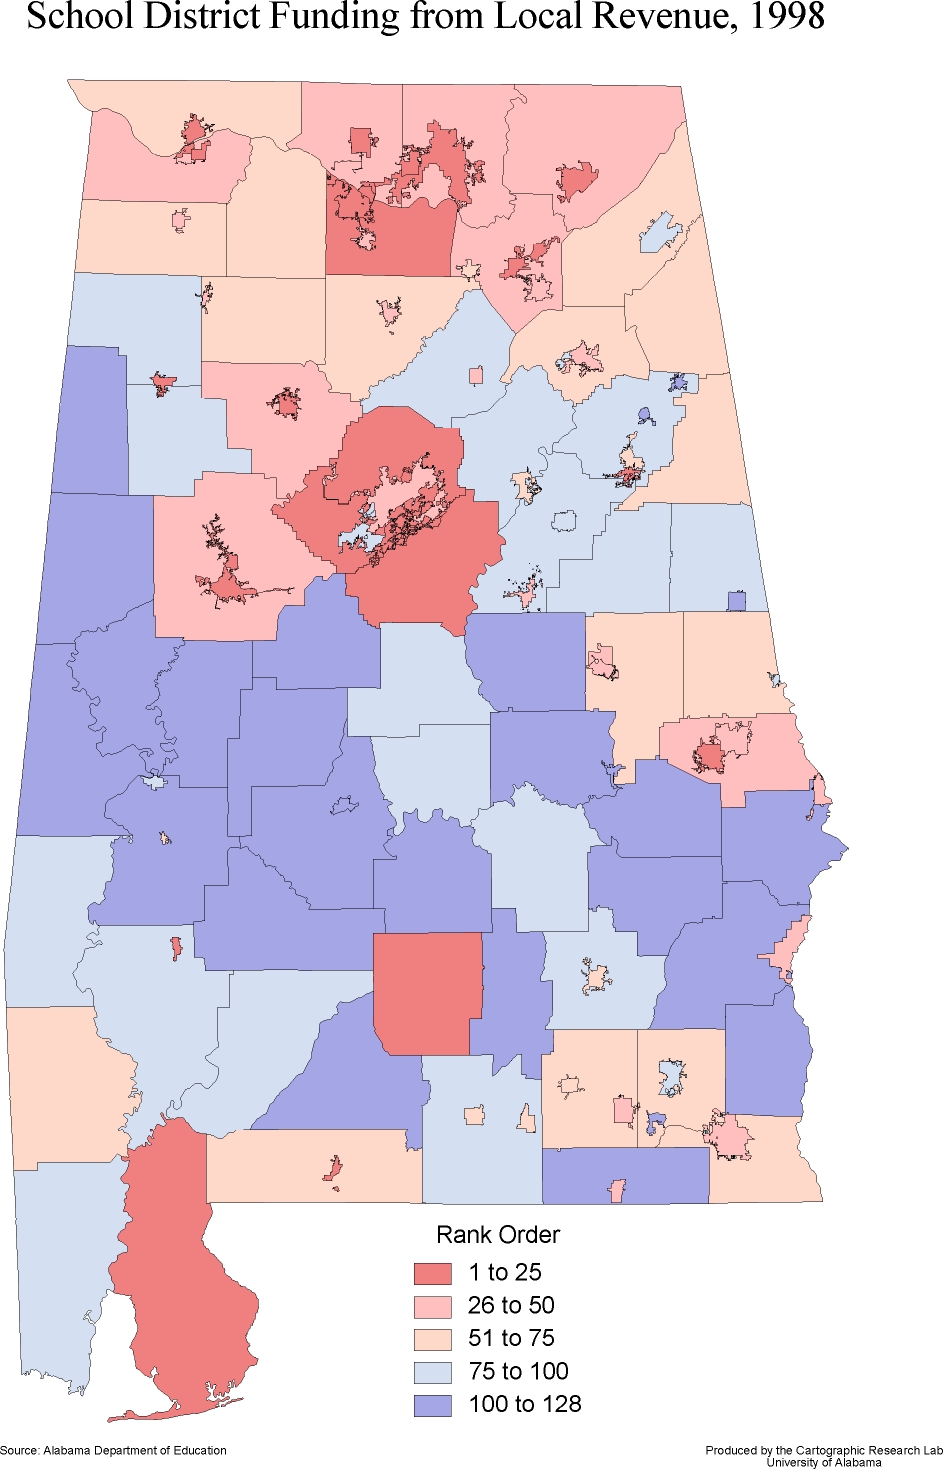
| School
District Funding from Local Revenue, 1998 |
|
| |
Format:  PDF  184kb
JPEG 385kb |
| |
| School district funding from local revenue. |
|
|
|
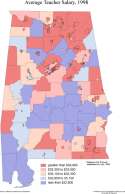
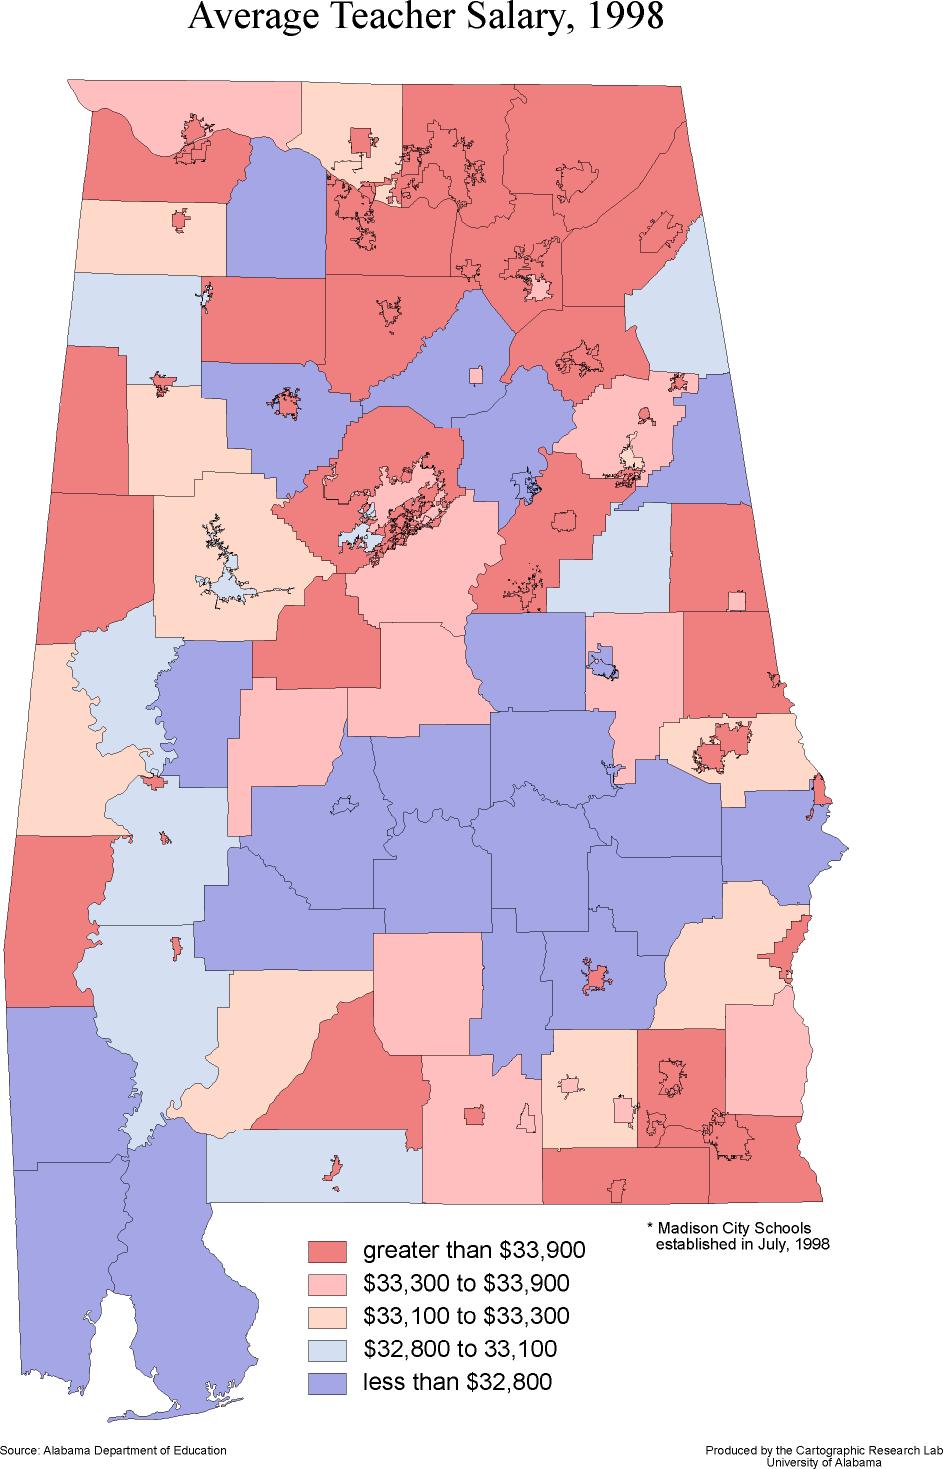
| Average
Teacher Salary, 1998 |
| 
|
| |
Format:  PDF  184kb
JPEG 129kb |
| |
| Average teacher salary, 1998. |
|
|
|
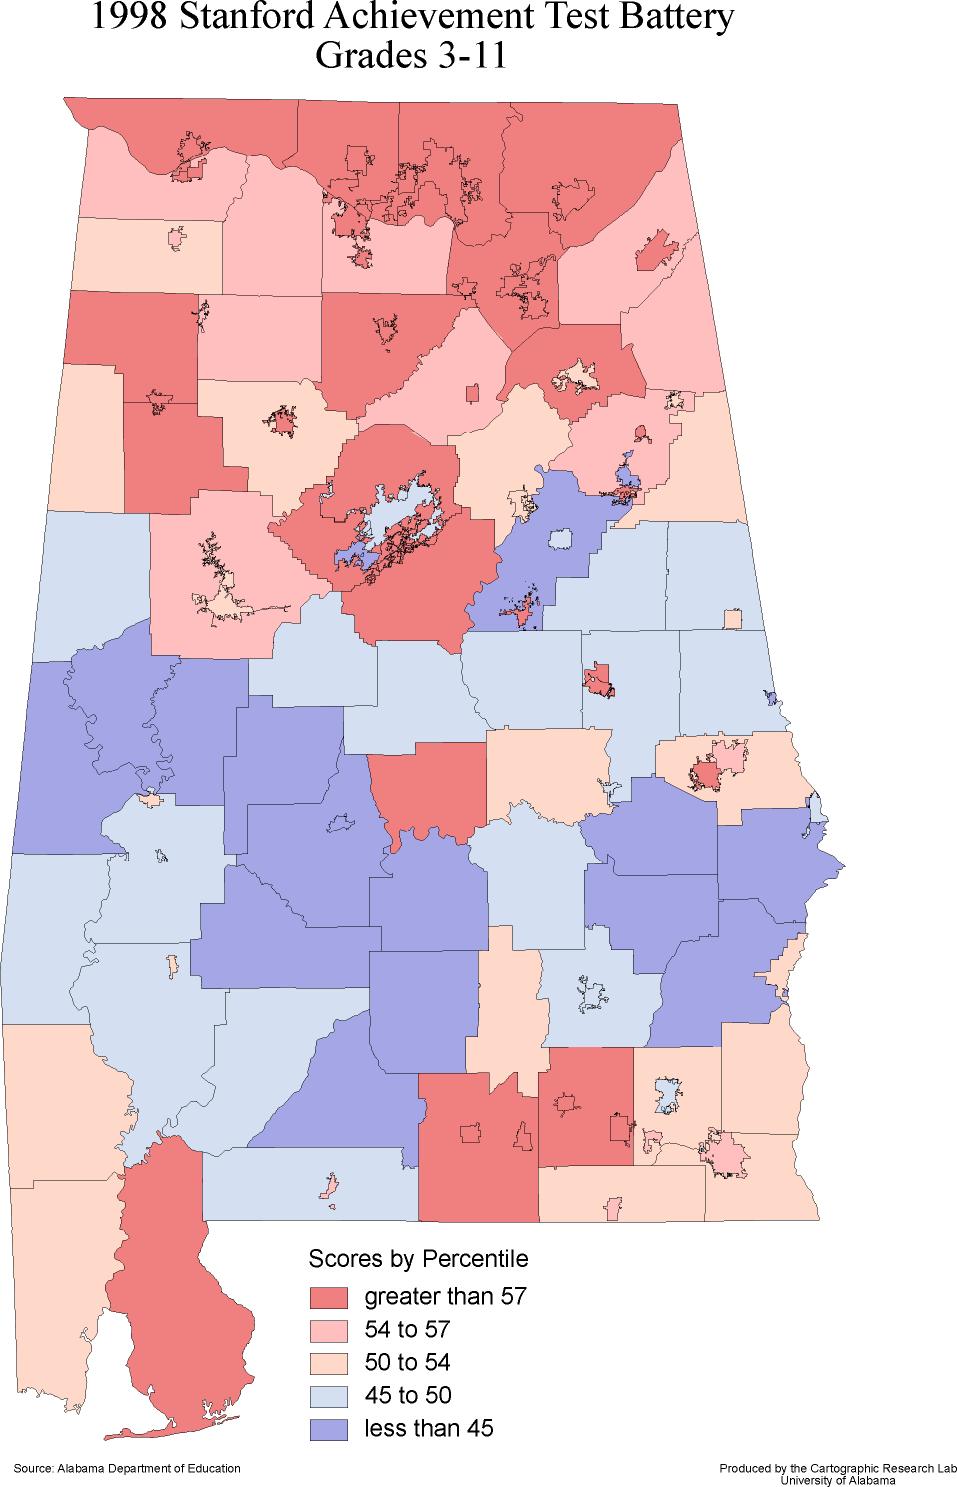
| 1998
Stanford Achievement Test Battery Grades 3-11 |
|
|
| |
Format:  PDF  182kb
JPEG 127kb |
| |
| 1998 SAT test battery, grades 3-11. |
|
|
|
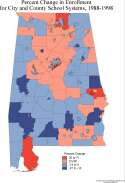
| Percent
Change in Enrollment for City and County School Systems, 1988-1998 |
| 
|
| |
Format: PDF 168kb
JPEG 137kb |
| |
| Percent change in enrollment for City and County school systems,
1998-1999. |
|
|
|
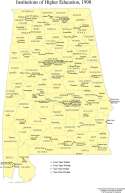
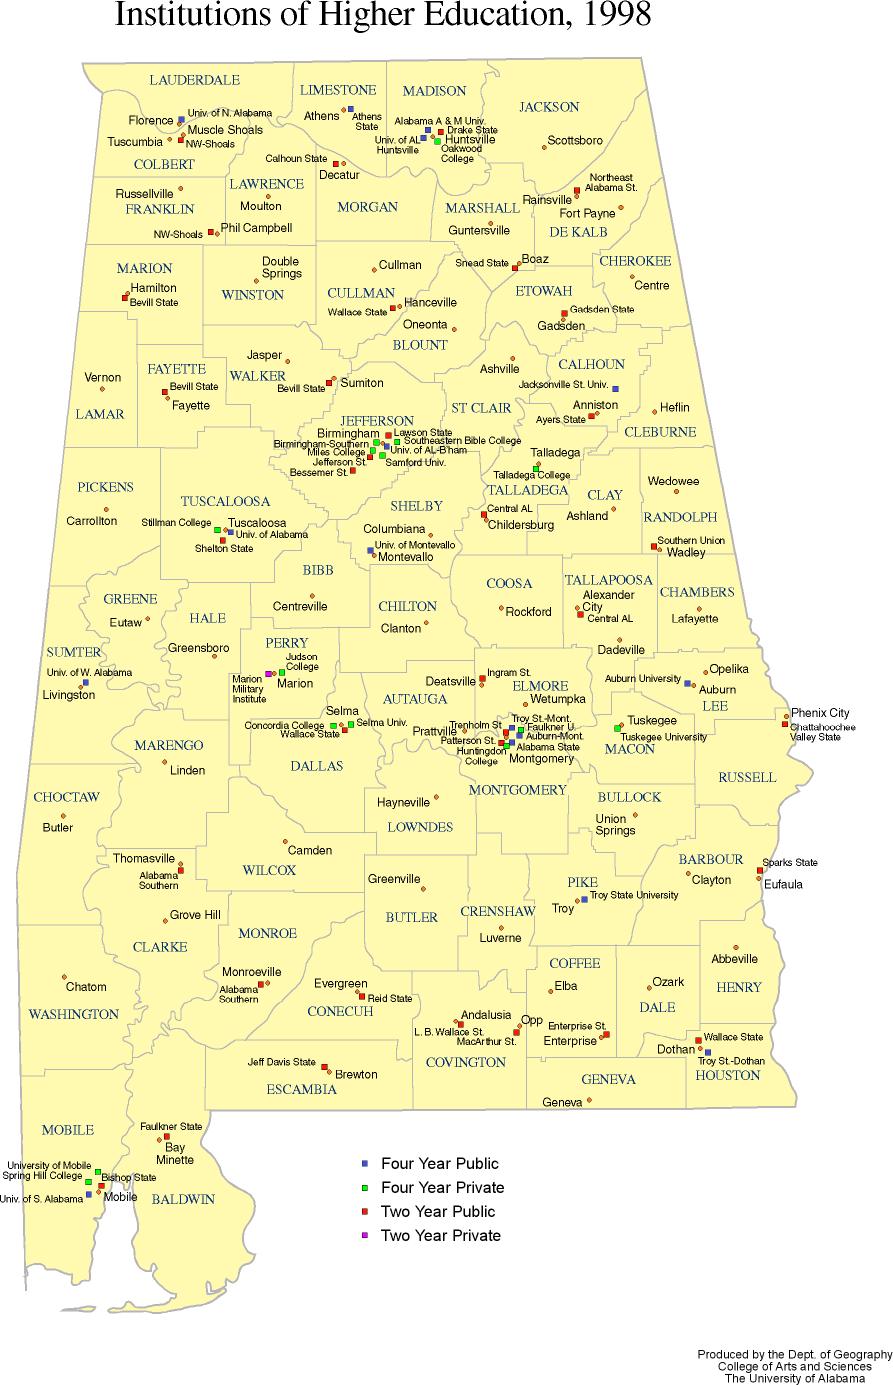
| Institutes
of Higher Education, 1998 |
|
| |
Format:  PDF 100kb
JPEG 175kb |
| |
| Institutes of higher education, 1998. |
|
|
|
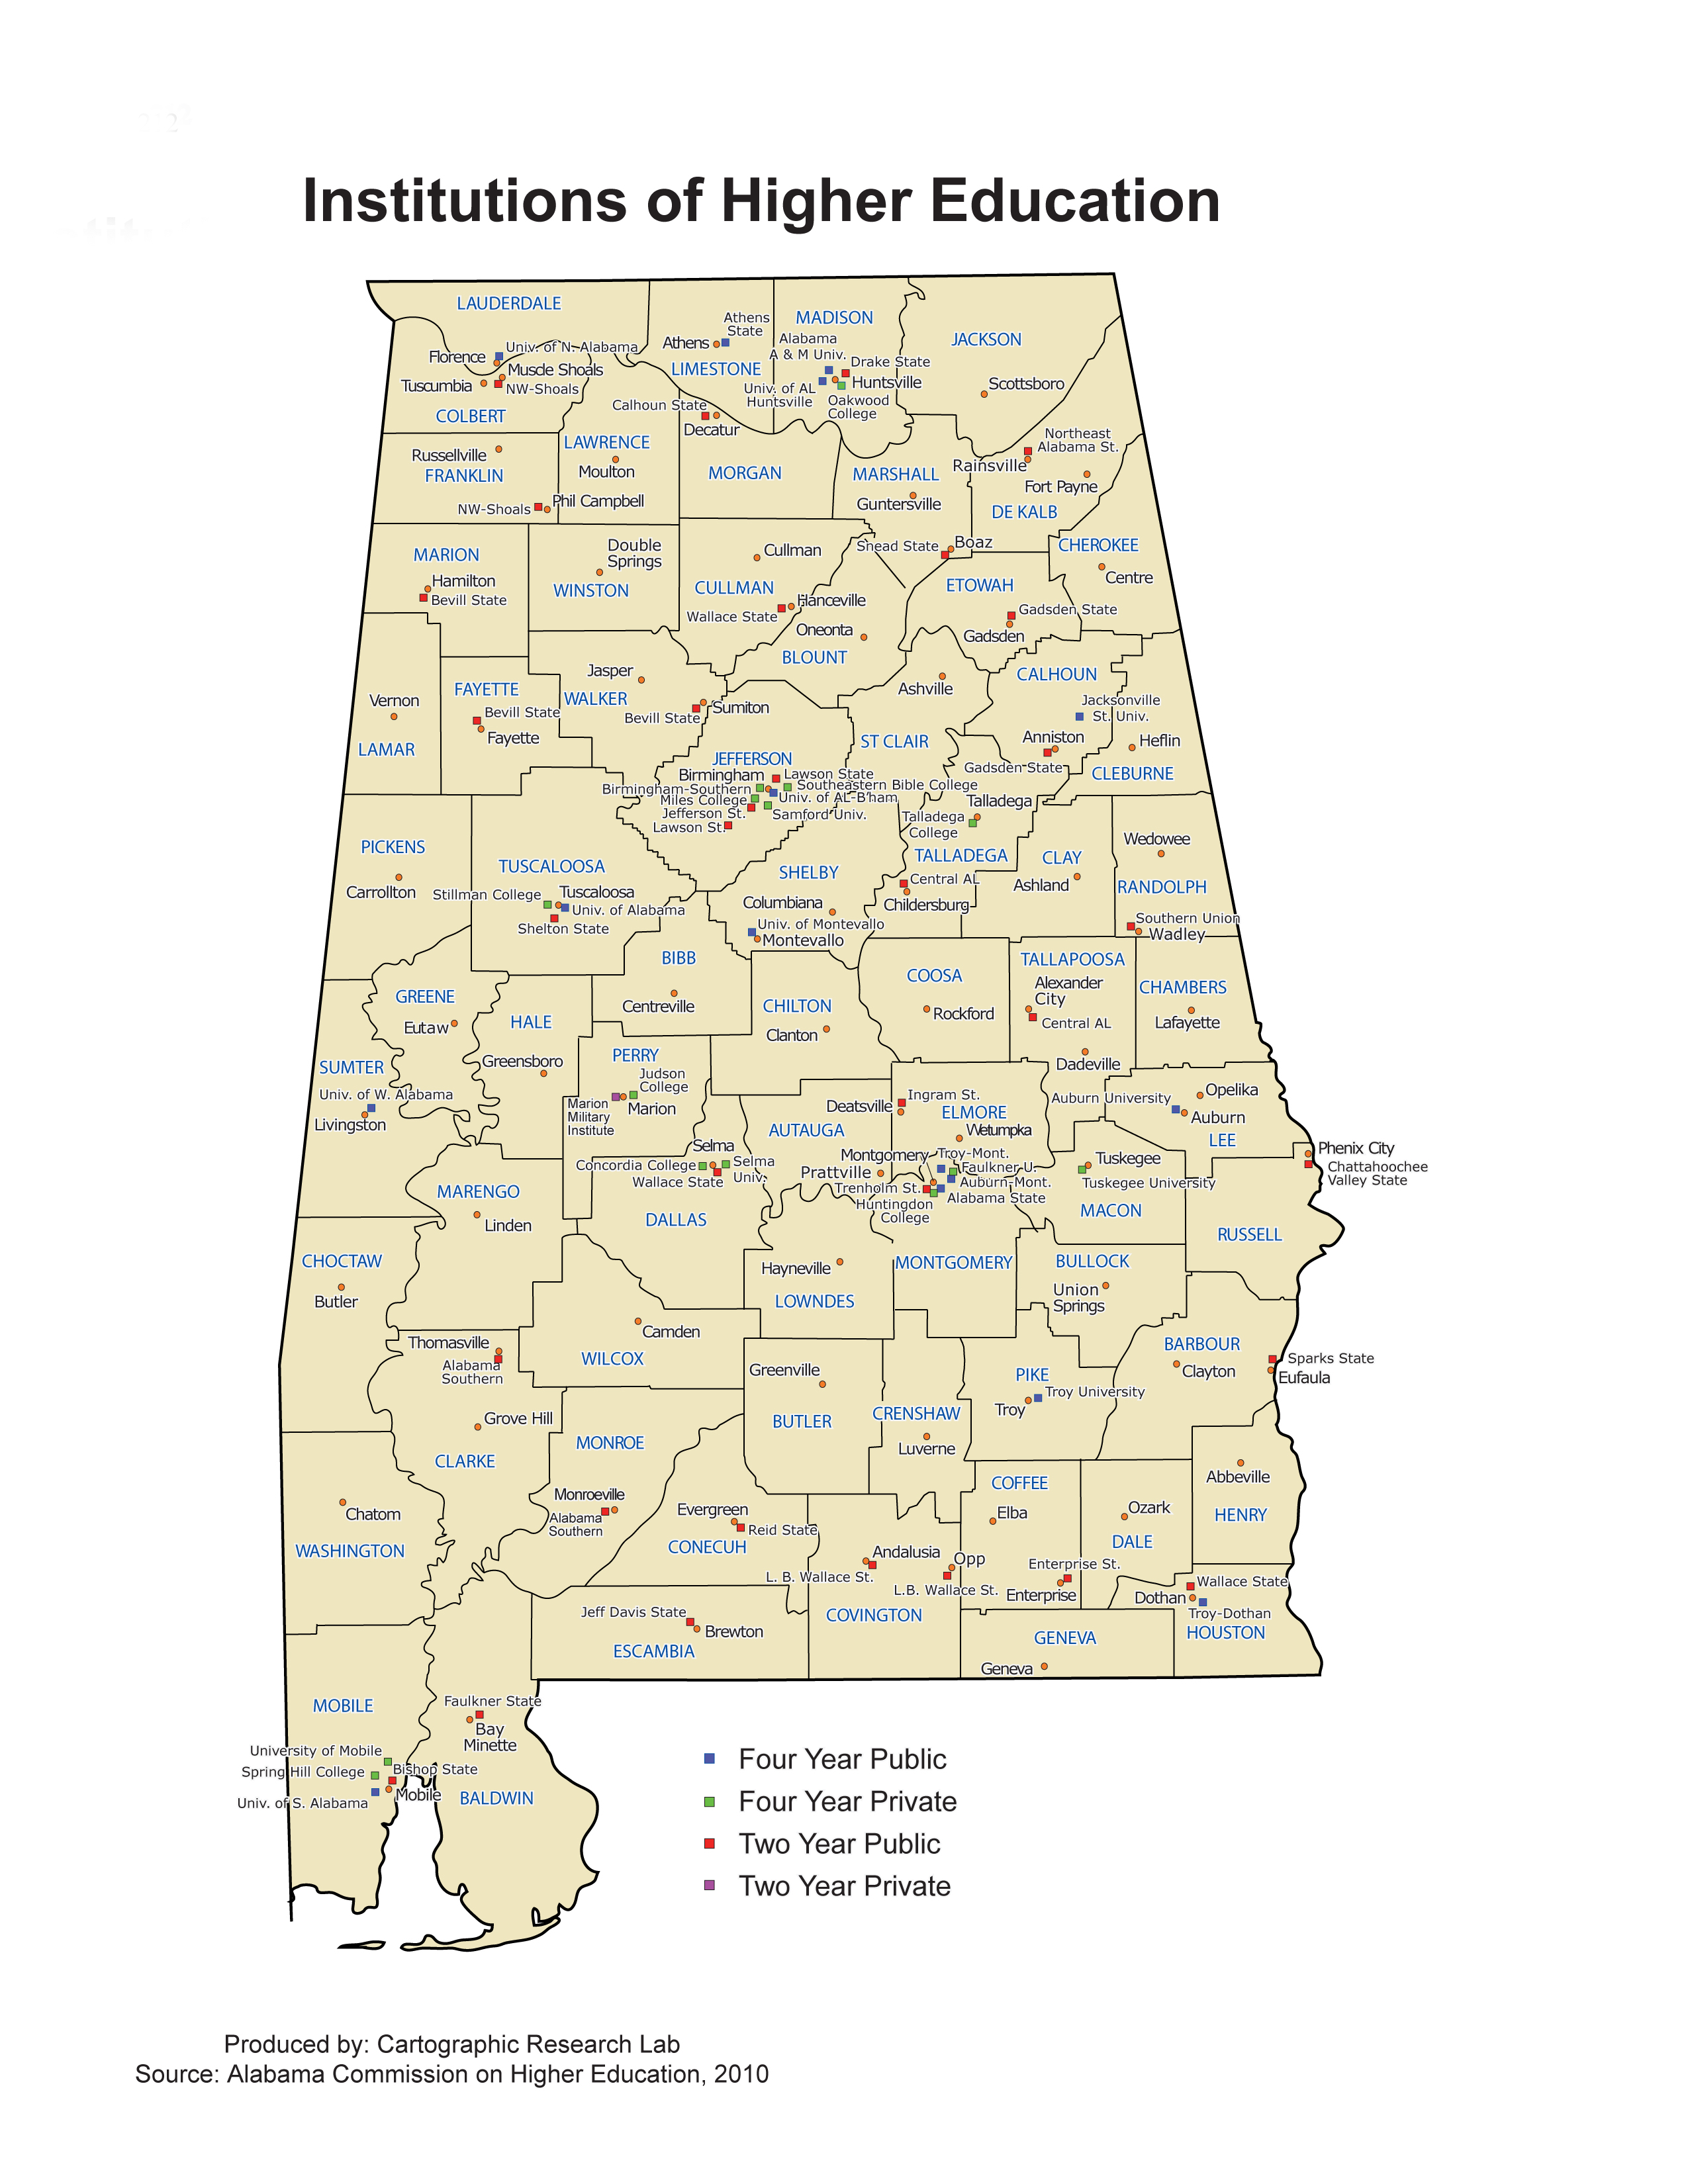
| Institutes
of Higher Education, 2010 |
|
| |
Format:  PDF
JPEG |
| |
| Institutes of higher education, 2010. |
|
|