| Housing
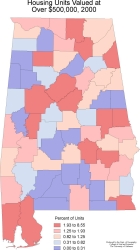
Units Valued at Over $500,000, 2000 |
|
|
|
Format: PDF  66kb
        JPEG 99kb
|
| |
| Housing Units Valued at Over $500,000, 2000. |
|
|
|
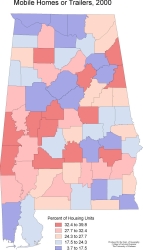
| Mobile
Homes or Trailers, 2000 |
|
|
|
Format: PDF  66kb
        JPEG 99kb
|
| |
| Mobile Homes or Trailers, 2000. |
|
|
|
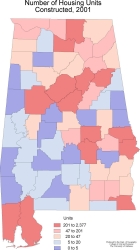
| Number
of Housing Units Constructed, 2001 |
|
|
|
Format: PDF  66kb
        JPEG 95kb
|
| |
| Number of Housing Units Constructed, 2001. |
|
|
|
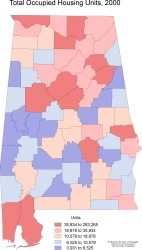
| Total
Occupied Housing Units, 2000 |
|
|
|
Format: PDF  66kb
        JPEG 97kb
|
| |
| Total Occupied Housing Units, 2000. |
|
|
|
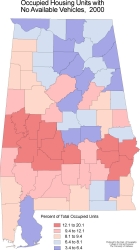
| Occupied
Housing Units with No Available Vehicles |
|
|
|
Format: PDF  66kb
        JPEG 68kb
|
| |
| Occupied Housing Units with No Available Vehicles. |
|
|
|
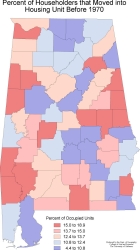
| Percent
of Householders that Moved into Housing Unit Before 1970 |
|
|
|
Format: PDF  66kb
        JPEG 102kb
|
| |
| Percent of Householders that Movel into Housing Unit Before
1970. |
|
|
|
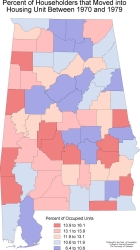
| Percent
of Householders that Moved into Housing Unit Between 1970 and 1979 |
|
|
|
Format: PDF  66kb
        JPEG 104kb
|
| |
| Percent of Householders that Moved into Housing Unit Between
1970 and 1979. |
|
|
|
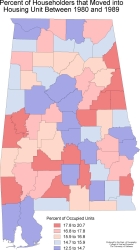
| Percent
of Householders that Moved into Housing Unit Between 1980 and 1989 |
|
|
|
Format: PDF  66kb
        JPEG 104kb
|
| |
| Percent of Householders that Moved into Housing Unit Between
1980 and 1989. |
|
|
|
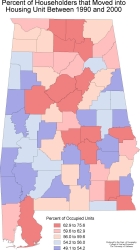
| Percent
of Householders that Moved into Housing Unit Between 1990 and 2000 |
|
|
|
Format: PDF  66kb
        JPEG 105kb
|
| |
| Percent of Householders that Moved into Housing Unit Between
1990 2000. |
|
|
|
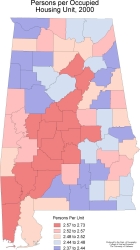
| Persons
per Occupied Housing Unit, 2000 |
|
|
|
Format: PDF  66kb
        JPEG 96kb
|
| |
| Persons per Occupied Housing Unit, 2000. |
|
|
|
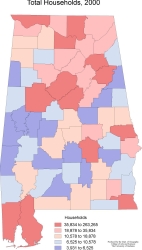
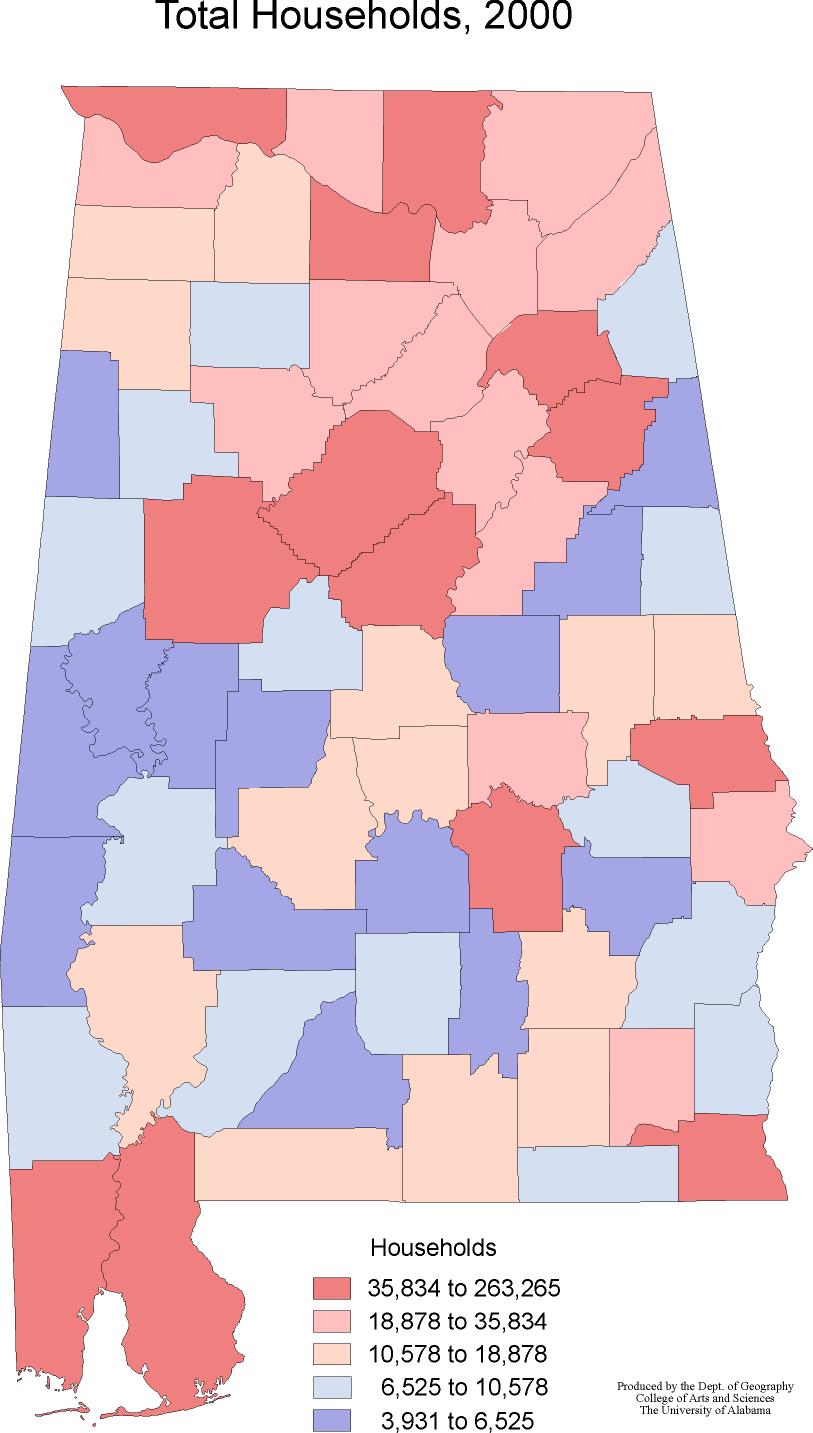
| Total
Households, 2000 |
|
|
|
Format: PDF  66kb
        JPEG 99kb
|
| |
| Total Households, 2000. |
|
|
|
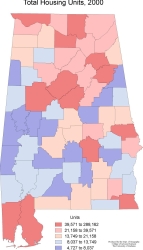
| Total
Housing Units, 2000 |
|
|
|
Format: PDF  66kb
        JPEG 94kb
|
| |
| Total Housing Units, 2000. |
|
|
|
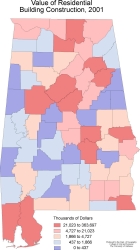
| Value
of Residential Building Construction, 2001 |
|
|
|
Format: PDF  66kb
        JPEG 100kb
|
| |
| Value of Residential Building Construction, 2001. |
|
|
|
|