| |
| Map Example |
 |
| Viewing
options: |
Title |
Author |
Scale |
|
Title Page |
Hydrographic Office, U.S. Navy |
|||
Table of Contents |
Hydrographic Office, U.S. Navy |
|||
Preface |
Hydrographic Office, U.S. Navy |
|||
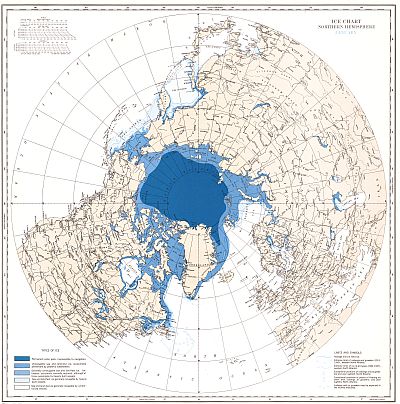
Ice Chart, Northern Hemisphere, January |
Hydrographic Office, U.S. Navy |
1:22,809,600 |
||
Ice Chart, Northern Hemisphere, February |
Hydrographic Office, U.S. Navy |
1:22,809,600 |
||
Ice Chart, Northern Hemisphere, March |
Hydrographic Office, U.S. Navy |
1:22,809,600 |
||
Ice Chart, Northern Hemisphere, April |
Hydrographic Office, U.S. Navy |
1:22,809,600 |
||
Ice Chart, Northern Hemisphere, May |
Hydrographic Office, U.S. Navy |
1:22,809,600 |
||
Ice Chart, Northern Hemisphere, June |
Hydrographic Office, U.S. Navy |
1:22,809,600 |
||
Ice Chart, Northern Hemisphere, July |
Hydrographic Office, U.S. Navy |
1:22,809,600 |
||
Ice Chart, Northern Hemisphere, August |
Hydrographic Office, U.S. Navy |
1:22,809,600 |
||
Ice Chart, Northern Hemisphere, September |
Hydrographic Office, U.S. Navy |
1:22,809,600 |
||
Ice Chart, Northern Hemisphere, October |
Hydrographic Office, U.S. Navy |
1:22,809,600 |
||
Ice Chart, Northern Hemisphere, November |
Hydrographic Office, U.S. Navy |
1:22,809,600 |
||
Ice Chart, Northern Hemisphere, December |
Hydrographic Office, U.S. Navy |
1:22,809,600 |
||
Extreme Limits, 1898-1938 |
Hydrographic Office, U.S. Navy |
1:29,568,000 |
||
River Ice in Relation to Navigation, Closing Dates (Northern Hemisphere) |
Hydrographic Office, U.S. Navy |
1:22,809,600 |
||
River Ice in Relation to Navigation, Opening Dates (Northern Hemisphere) |
Hydrographic Office, U.S. Navy |
1:22,809,600 |
||
River Ice in Relation to Navigation, Average Annual Number of Days with Ice (Northern Hemisphere) |
Hydrographic Office, U.S. Navy |
1:22,809,600 |
||
Grand Banks Region Index Chart for Ice Data Tables |
Hydrographic Office, U.S. Navy |
1:3,800,000 |
||
Ice Data Chart, Grand Banks Region (United States, Canada, St. Pierre and Miquelon, Newfoundland-Labrador) |
Hydrographic Office, U.S. Navy |
1:3,800,000 |
||
Ice Data Table, Grand Banks Region (Newfoundland) |
Hydrographic Office, U.S. Navy |
|||
Ice Chart, Grand Banks Region, January |
Hydrographic Office, U.S. Navy |
1:3,800,000 |
||
Ice Chart, Grand Banks Region, February |
Hydrographic Office, U.S. Navy |
1:3,800,000 |
||
Ice Chart, Grand Banks Region, March |
Hydrographic Office, U.S. Navy |
1:3,800,000 |
||
Ice Chart, Grand Banks Region, April |
Hydrographic Office, U.S. Navy |
1:3,800,000 |
||
Ice Chart, Grand Banks Region, May |
Hydrographic Office, U.S. Navy |
1:3,800,000 |
||
Ice Chart, Grand Banks Region, June |
Hydrographic Office, U.S. Navy |
1:3,800,000 |
||
Ice Chart, Grand Banks Region, July |
Hydrographic Office, U.S. Navy |
1:3,800,000 |
||
Ice Chart, Grand Banks Region, August |
Hydrographic Office, U.S. Navy |
1:3,800,000 |
||
Ice Chart, Grand Banks Region, September |
Hydrographic Office, U.S. Navy |
1:3,800,000 |
||
Ice Chart, Grand Banks Region, October |
Hydrographic Office, U.S. Navy |
1:3,800,000 |
||
Ice Chart, Grand Banks Region, November |
Hydrographic Office, U.S. Navy |
1:3,800,000 |
||
Ice Chart, Grand Banks Region, December |
Hydrographic Office, U.S. Navy |
1:3,800,000 |
||
Ice Chart, Grand Banks Region, January and February (Icebergs and Growlers Reported) |
Hydrographic Office, U.S. Navy |
1:4,750,000 |
||
Ice Chart, Grand Banks Region, March and April (Icebergs and Growlers Reported) |
Hydrographic Office, U.S. Navy |
1:4,750,000 |
||
Ice Chart, Grand Banks Region, May and June (Number of Icebergs and Growlers Reported) |
Hydrographic Office, U.S. Navy |
1:4,750,000 |
||
Ice Chart, Grand Banks Region, July and August (Number of Icebergs and Growlers Reported) |
Hydrographic Office, U.S. Navy |
1:4,750,000 |
||
Ice Chart, Grand Banks Region, September and October (Number of Icebergs and Growlers Reported) |
Hydrographic Office, U.S. Navy |
1:4,750,000 |
||
Ice Chart, Grand Banks Region, November and December (Number of Icebergs and Growlers Reported) |
Hydrographic Office, U.S. Navy |
1:4,750,000 |
||
Baltic Sea Index Chart for Ice Data Tables |
Hydrographic Office, U.S. Navy |
1:2,534,000 |
||
Ice Data Tables, Baltic Sea (Germany and Denmark) |
Hydrographic Office, U.S. Navy |
|||
Ice Data Table, Baltic Sea (Denmark, Danzig, Lithuania, Latvia and Estonia) |
Hydrographic Office, U.S. Navy |
|||
Ice Data Table, Baltic Sea (Estonia, U.S.S.R., Finland and Sweden) |
Hydrographic Office, U.S. Navy |
|||
Ice Data Table, Baltic Sea (Sweden) |
Hydrographic Office, U.S. Navy |
|||
Ice Data Table, Baltic Sea (Sweden) |
Hydrographic Office, U.S. Navy |
|||
Ice Data Table, Baltic Sea (Sweden) |
Hydrographic Office, U.S. Navy |
|||
Ice Data Table, Baltic Sea (Sweden and Norway) |
Hydrographic Office, U.S. Navy |
|||
Ice Chart, Baltic Sea, October |
Hydrographic Office, U.S. Navy |
1:2,534,000 |
||
Ice Chart, Baltic Sea, November |
Hydrographic Office, U.S. Navy |
1:2,534,000 |
||
Ice Chart, Baltic Sea, December |
Hydrographic Office, U.S. Navy |
1:2,534,000 |
||
Ice Chart, Baltic Sea, January |
Hydrographic Office, U.S. Navy |
1:2,534,000 |
||
Ice Chart, Baltic Sea, February |
Hydrographic Office, U.S. Navy |
1:2,534,000 |
||
Ice Chart, Baltic Sea, March |
Hydrographic Office, U.S. Navy |
1:2,534,000 |
||
Ice Chart, Baltic Sea, April |
Hydrographic Office, U.S. Navy |
1:2,534,000 |
||
Ice Chart, Baltic Sea, May |
Hydrographic Office, U.S. Navy |
1:2,534,000 |
||
Ice Chart, Baltic Sea, June |
Hydrographic Office, U.S. Navy |
1:2,534,000 |
||
Black Sea Index Chart for Ice Data Tables |
Hydrographic Office, U.S. Navy |
1:2,975,000 |
||
Ice Data Table, Black Sea Region Ice Chart, Average Annual Number of Days with Ice |
Hydrographic Office, U.S. Navy |
1:2,534,000 |
||
Ice Chart, Black Sea, November and December |
Hydrographic Office, U.S. Navy |
1:2,850,000 |
||
Ice Chart, Black Sea, January and February |
Hydrographic Office, U.S. Navy |
1:2,850,000 |
||
Ice Chart, Black Sea, March and April |
Hydrographic Office, U.S. Navy |
1:2,850,000 |
||
White Sea Index Chart for Ice Data Table |
Hydrographic Office, U.S. Navy |
1:2,534,000 |
||
Ice Chart - White Sea, October through June |
Hydrographic Office, U.S. Navy |
1:3,675,000 |
||
Okhotsk Sea Region Index Chart for Ice Data Tables |
Hydrographic Office, U.S. Navy |
1:5,000,000 |
||
Ice Data Table, Okhotsk Sea Region (Korea and U.S.S.R.) |
Hydrographic Office, U.S. Navy |
|||
Ice Data Table, Okhotsk Sea Region (U.S.S.R.) |
Hydrographic Office, U.S. Navy |
|||
Ice Data Table, Okhotsk Sea Region (U.S.S.R. and Japan) |
Hydrographic Office, U.S. Navy |
|||
Ice Data Table, Okhotsk Sea Region (Japan) |
Hydrographic Office, U.S. Navy |
|||
Ice Chart, Okhotsk Sea Region, October |
Hydrographic Office, U.S. Navy |
1:4,750,000 |
||
Ice Chart, Okhotsk Sea Region, November |
Hydrographic Office, U.S. Navy |
1:4,750,000 |
||
Ice Chart, Okhotsk Sea Region, December |
Hydrographic Office, U.S. Navy |
1:4,750,000 |
||
Ice Chart, Okhotsk Sea Region, January |
Hydrographic Office, U.S. Navy |
1:4,750,000 |
||
Ice Chart, Okhotsk Sea Region, February |
Hydrographic Office, U.S. Navy |
1:4,750,000 |
||
Ice Chart, Okhotsk Sea Region, March |
Hydrographic Office, U.S. Navy |
1:4,750,000 |
||
Ice Chart, Okhotsk Sea Region, April |
Hydrographic Office, U.S. Navy |
1:4,750,000 |
||
Ice Chart, Okhotsk Sea Region, May |
Hydrographic Office, U.S. Navy |
1:4,750,000 |
||
Ice Chart, Okhotsk Sea Region, June |
Hydrographic Office, U.S. Navy |
1:4,750,000 |
||
Ice Chart, Okhotsk Sea Region, July |
Hydrographic Office, U.S. Navy |
1:4,750,000 |
||
Ice Chart, Okhotsk Sea Region, August |
Hydrographic Office, U.S. Navy |
1:4,750,000 |
|
|
||
|
©
University of Alabama
|
To purchase map reproductions, submit a quote
request.
|
|