| |
| Title
Page |
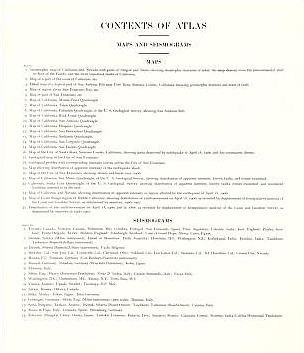
Table
of Contents |
|
 |
 |
|
| Viewing
options: |
Title |
Scale |
||
| Map 1 - Geomorphic Map of California and Nevada with parts of Oregon and Idaho (North) | 1:1,901,000 |
|||
| Map 1 - Geomorphic Map of California and Nevada with parts of Oregon and Idaho (South) | 1:1,901,000 | |||
| Map 2 - Map of a Portion of th Coast of California Showing the San Andreas Rift | 1:142,500 |
|||
| Map 3 - Detail Map of a typical portion of the San Andreas Rift near Ft. Ross, Somoma County, California | 1:3,960 |
|||
| Map 4 - Map of the Region About San Francisco Bay showing the Relationship of the City of San Francisco to the San Andreas Rift (North) | 1:190,000 |
|||
| Map 4 - Map of the Region About San Francisco Bay showing the Relationship of the City of San Francisco to the San Andreas Rift (South) | 1:190,000 |
|||
| Map 5 - Map of a Portion of the Coast Range of Mountains Showing the San Andreas Rift | 1:760,320 |
|||
| Map 6 - Mount Pinos Quadrangle | 1:125,000 |
|||
| Map 7 - Tejon Quadrangle | 1:125,000 |
|||
| Map 8 - Palmdale Quadrangle | 1:125,000 |
|||
| Map 9 - Rock Creek Quadrangle | 1:62,500 |
|||
| Map 10 - San Antonio Quadrangle | 1:62,500 |
|||
| Map 11 -Hesperia Quadrangle | 1:62,500 |
|||
| Map 12 - San Bernardino Quadrangle | 1:62,500 |
|||
| Map 13 - Redlands Quadrangle | 1:62,500 |
|||
| Map 14 - San Gorgonio Quadrangle |
1:125,000 |
|||
| Map 15 - San Jacinto Quadrangle | 1:125,000 |
|||
| Map 16 - Map of the City of Santa Rosa, Sonoma County, California Showing the Portions Destoryed by the Earthquake of April 18, 1906 |
1:11,000 |
|||
| Map 17 - Geological Map of the City of San Fransico | 1:40,000 |
|||
| Map 18 - Geological Profiles with Corresponding Intensity Curves across the City of San Francisco |
- |
|||
| Map 19 - Map of San Franciso Showing Distribution of Apparent Intensity of the Earthquale Shock | 1:40,000 |
|||
| Map 20 - Map of the City of San Francisco Showing streets and burnt areas, 1906 |
1:22,200 |
|||
| Map 21 - San Matea Quadrangle Showing the distribution of Apparent Intensit, the known faults and the routes examined | 1:62,500 |
|||
| Map 22 - Santa Cruz Quadrangle Showing the distribution of Apparent Intensity, the known faults, and the routes examined |
1:125,000 |
|||
| Map 23 - Map of California and Nevada Showing the distribution of Apparent Intensity | 1:1,901,000 |
|||
| Map 24 - Map of the Coast Range Region of Middle California Showing the distribution of earth movement on April 18, 1906 |
1:633,600 |
|||
| Map 25 - Distibution of earth movement on April 18, 1906 and in 1868 | 1:142,500 |
|
|
||
|
©
University of Alabama
|
To purchase map reproductions, submit a quote
request.
|
|